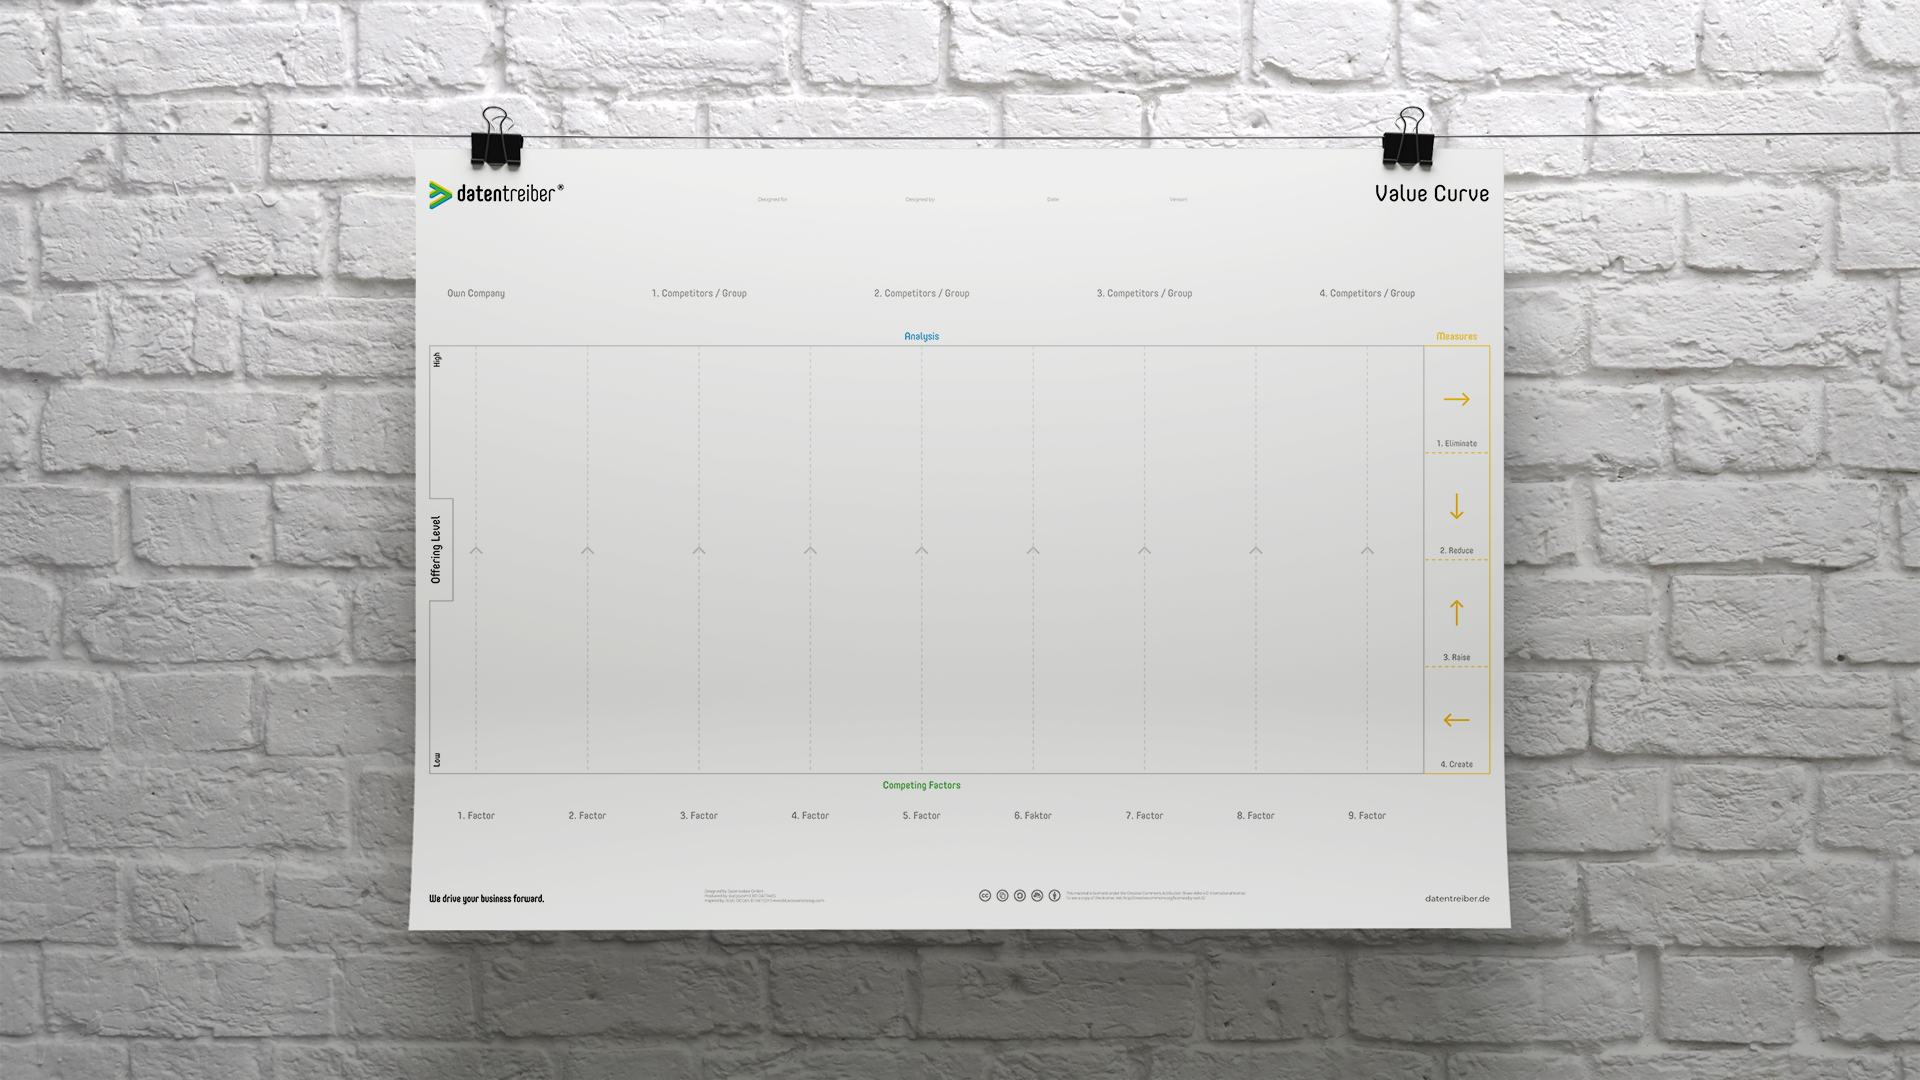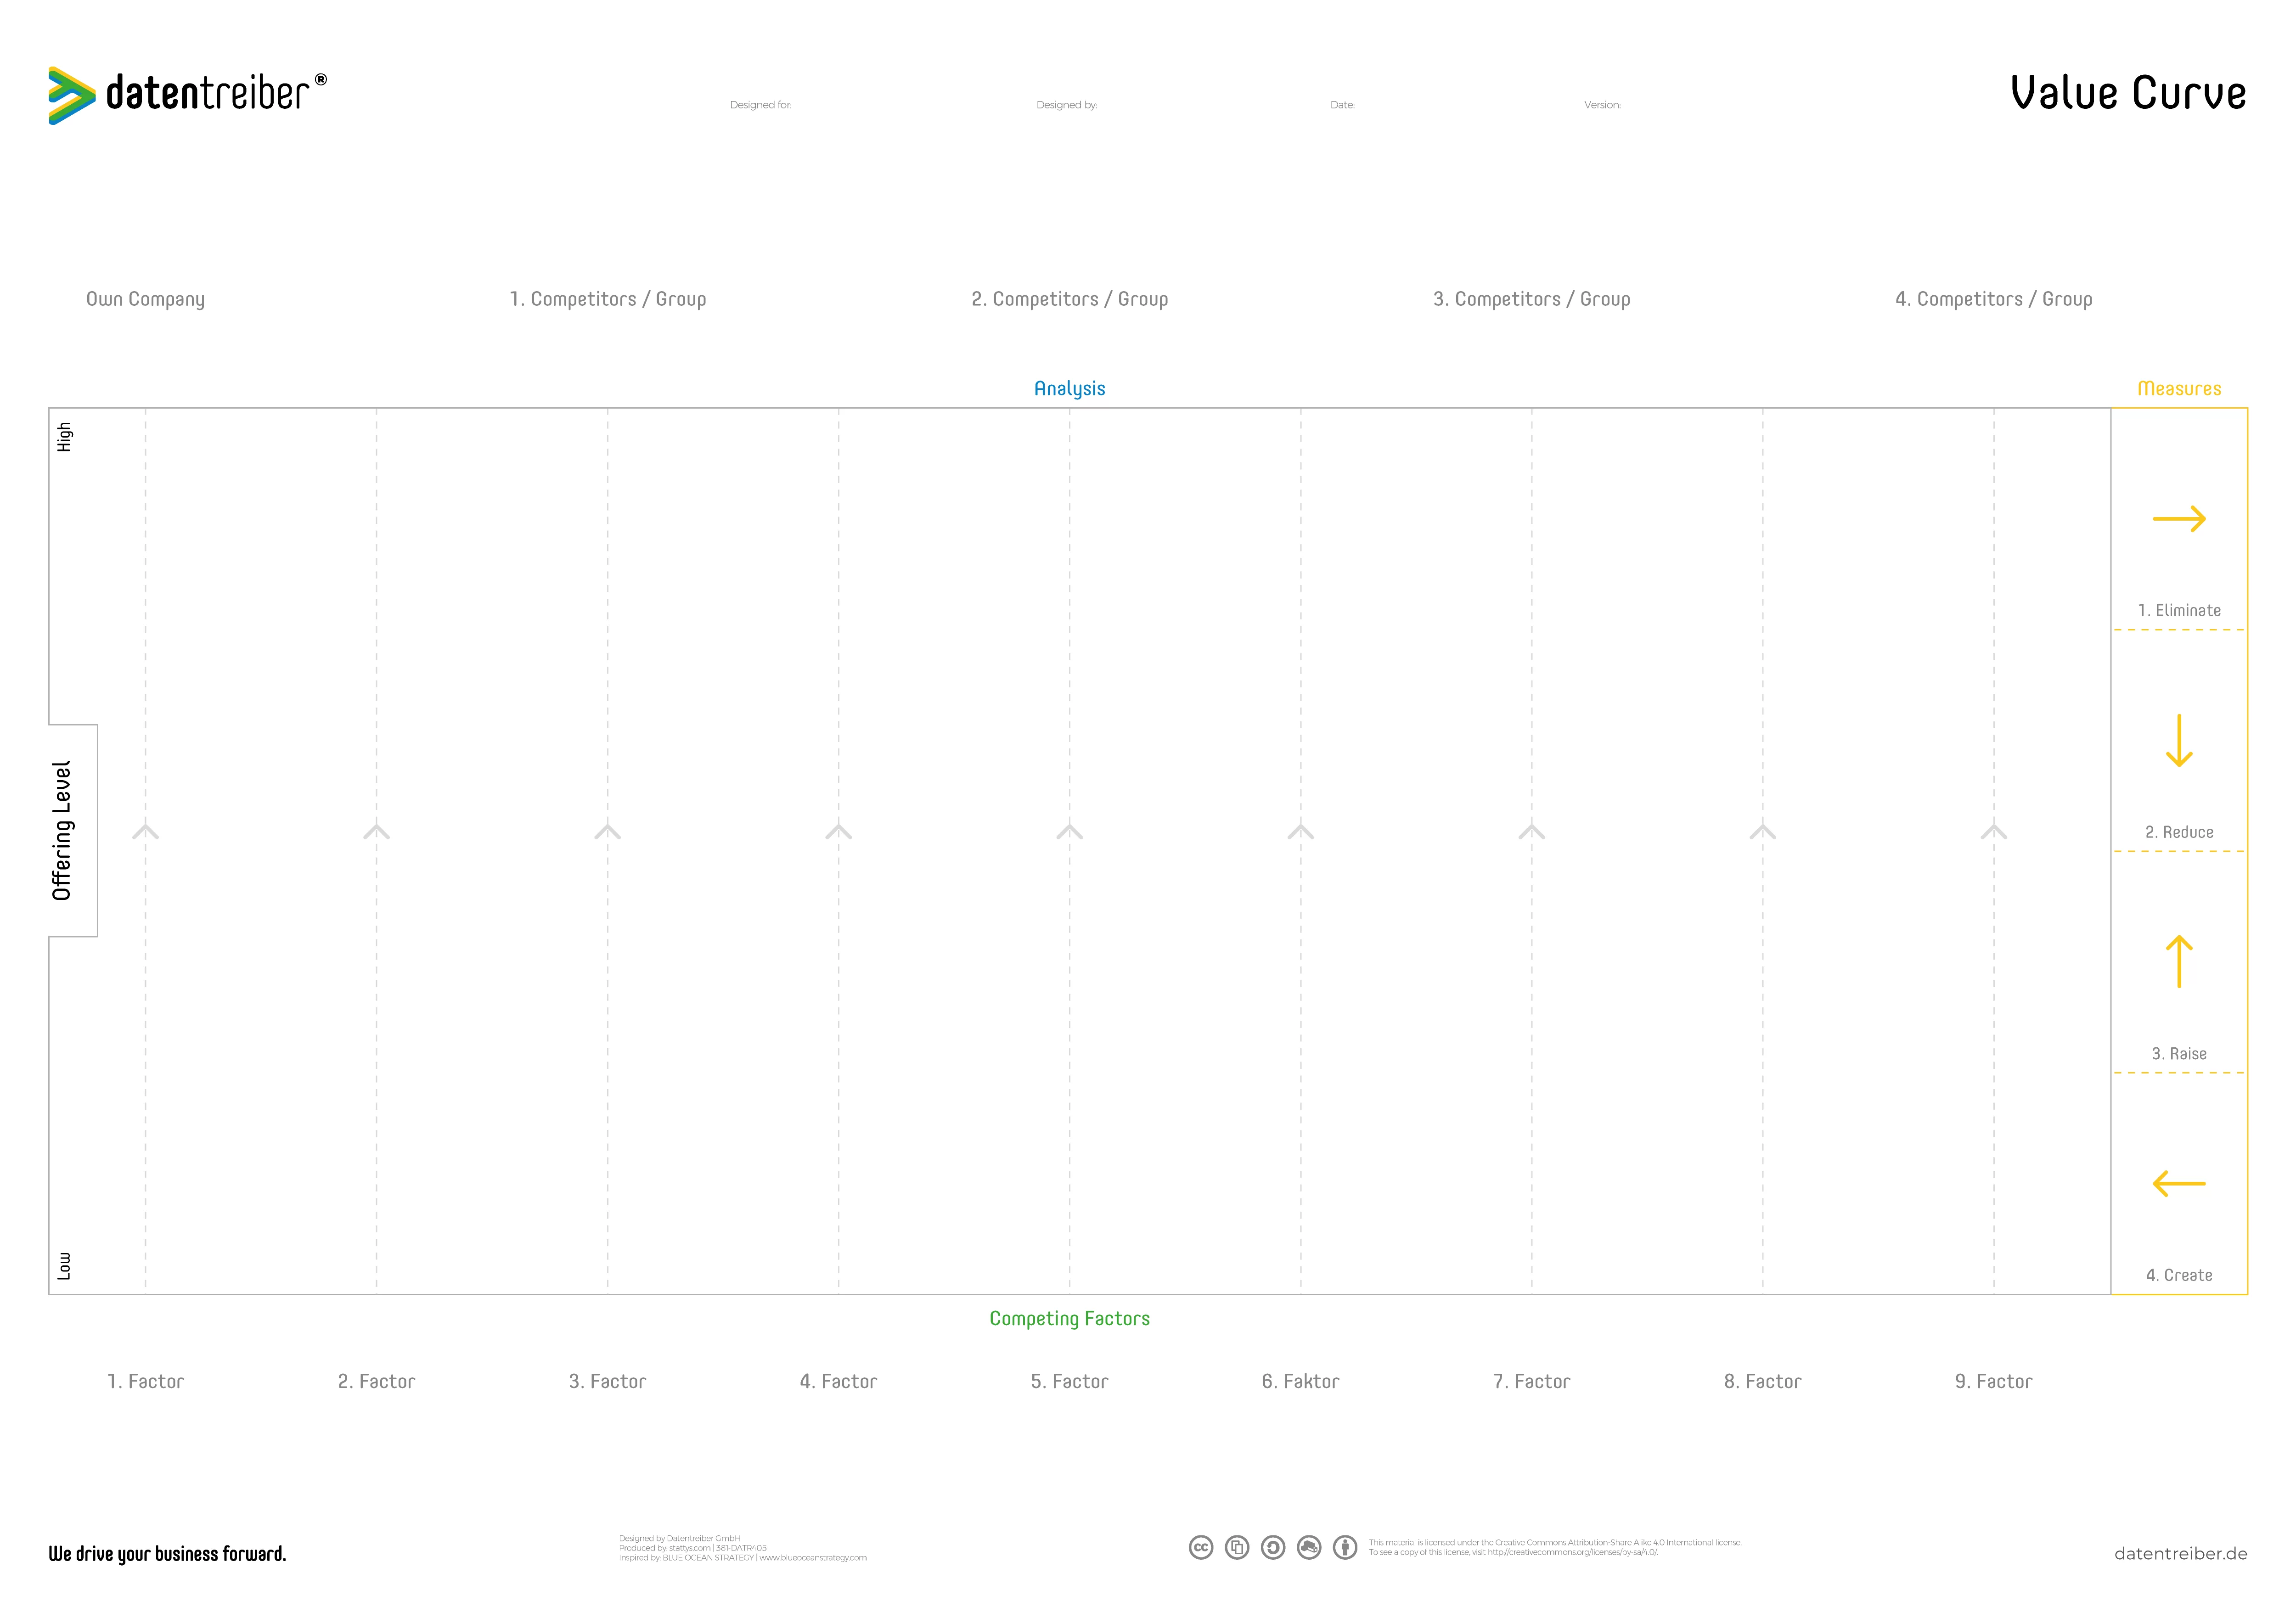
Value Curve Canvas
Using the Value Curve Canvas you can determine the critical product or service features for the value proposition which allow you to differentiate yourself from the competition or to create a new market (“Blue Ocean”). The prioritization tool supports you in reducing or eliminating the irrelevant factors and to raise or create the relevant factors.
We drive your business forward.
What Is the Value Curve Canvas?
The Value Curve Canvas visualizes the strengths and weaknesses of different value propositions (see also respective canvas) regarding a certain product or service feature (so-called “factors”). It allows for prioritizing of factors and hence leads to more efficient and effective product development. To focus on the critical factors you can choose from four measures:
- Eliminate: Over time certain factors do not play anymore any role because of changing customer needs or your product targets a new audience which is not interested in these factors.
- Reduce: Other factors might be still relevant but not (anymore) decisive when it comes to a buying decision. Hence these factors can be developed to a lower extend.
- Raise: Vice versa the decisive factors should be strengthened or …
- Create: … factors should be considered which products of the competition do not yet offer.
The Value Curve Canvas is available for free under a Creative Commons license: you may use and modify the canvas as long as you cite Datentreiber in particular as the source.
We drive your business forward.

We drive your business forward.
How Do I Use the Value Curve Canvas?
The Analytics Use Case Canvas lets you design products and services that solve your customers’ problems and create added value for them. In addition and in order to differentiate your value proposition from the competition, you should focus on the product and service features that are critical to your target audience’s buying decision. The Value Curve Canvas lets you compare your value proposition with your competition’s offerings in terms of various factors, so you can decide which factors you will:
- Eliminate because your customers do not value these.
- Reduce because these are not crucial for the buying decision.
- Create, for example in order to reach a new target audience.
- Extend because these differentiate you from your competition.
For more information, see Data Strategy Design.
Step 1 of 5
Competitive Factors
After designing your value proposition using the Analytics Use Case Canvas, transfer the elements of your value proposition to the Value Curve Canvas. These are the elements in the Benefit field on the Analytics Use Case Canvas. Each element corresponds to a competitive factor, based on which a customer decides for your product or service or for your competition’s offer. You place the competitive factors on the template in the lower area on the fields “1st Factor”, “2nd Factor” and so on. Examples of purchasing factors include price, functionality or features, quality, brand image, handling, and many more.
Step 2 of 5
Competitors
Next, decide who your competitors are. These should offer comparable value propositions. If necessary, group similar competitors together if the target customers and products or services are very similar. Give each competitor or group a distinct color and place a respectively colored card with the corresponding competitor’s name or group as a caption on the template in the fields “1st competitor / group”, “2nd competitor / group” etc. The first field “Own Company” is intended for your company. This field must be also filled with a colored card.
Remember that your company has both direct and indirect competitors. As an airline, for example, you are competing with both low-cost airlines (first group) and premium airlines (second group) as well as railway companies, bus companies, car rental companies, carpools, and many other market participants.
Step 3 of 5
Offer Strength
Next, you go through the competitive factors from left to right and determine their offer strength for your company’s value proposition as well as for your competitors. A high offer strength means that this factor is very strongly pronounced for the respective company. The customer perceives it positively. As an example: A particularly low-priced value proposition is especially distinctive in terms of the factor price. Place for each competitor or group, as well as for your company, a respectively colored card along the dashed vertical line so that the relative position of the cards reflects the factor’s offer strength of the value proposition.
After you have gone through all the factors, you may sort the factors according to their offer strength:
- Factors in which your company scores to a high degree are placed as far to the left as possible.
- Factors in which your competition scores are placed as far to the right as possible.
As a result, your value curve runs from the top left to the bottom right, while one of your competitors runs from the bottom left to the top right.
Step 4 of 5
Measures
To really stand out from the competition, the distance between the two curves should be as big as possible on the left side. Ideally, you are offering a product or service which did not exist yet in this way and is, therefore “uncontested”. This is also known as the Blue Ocean Strategy. You have four measures available to increase or achieve this competitive advantage (see the right-hand side of the canvas):
- Eliminate: Product and performance features that are weak in your value proposition but your competition has a leading position in those, can be eliminated if, for example, your target audience does not value these factors or in case the buying behavior of customers fundamentally changes. The elimination may let you save development and production costs. In turn, you can use this saved money somewhere else, for example, to introduce new product features.
- Reduce: Some factors cannot be eliminated. This is for example true for the price. But if this factor plays a minor role for your targeted customers, you should not try to compete on it. You may consider reducing this factor by, for example, increasing the price to get the means to increase other factors.
- Raise: You should try to increase factors that are relevant to your customers as much as possible. Do this to clearly differentiate from your competition. Usually, this can only be done by reducing other factors.
- Create: Finally, there are product and performance features that your competitors have not yet thought of, but which are crucial to the customers’ buying decision. For example, for an airline, this could be a complimentary internet connection on the plane.
Step 5 of 5
Prioritization
After you have taken these measures, it is advisable to re-sort the value curve according to the offered strength of the factors (see OFFER STRENGTH), so that the factors that distinguish your product or service are placed on the left. These factors should get the appropriate attention while developing and marketing your value proposition. Hence, these should be highlighted on the Value Proposition Canvas.
We drive your business forward.
Where Can I Find More Information?
Here you can find further documentation:
Instructions manual (Stattys)
Data Thinker Group (LinkedIn)
The Value Curve Canvas’ concept originates from the book “Blue Ocean Strategy”,
We drive your business forward.
How Can I Start?
Seminars

Get to know our Data Strategy Design Method in our practical seminars:
- For beginners: Data Strategy & Culture
- For rising stars: Data Design Thinking
- For advanced designers: Data Business Consulting
Cross References

Here you can find further canvas and information concerning Data Strategy Design:
License Terms

You are free to:
Share — copy and redistribute the canvas in any medium or format
Adapt — remix, transform, and build upon the canvas
for any purpose, even commercially.
Under the following terms:
Attribution
ShareAlike
We drive your business forward.
Subscribe to our newsletter:
Receive all relevant blog articles, new seminar dates, special conference offers and much more conveniently by email. As a welcome gift, we will send you a link to download our Datentreiber design book (in German) and, for a short time, the article ” Data Thinking: mehr Wert aus Daten” in PDF form after your registration.
By clicking ‘Subscribe to our newsletter’ you agree that we process your information in accordance with our privacy policy.


