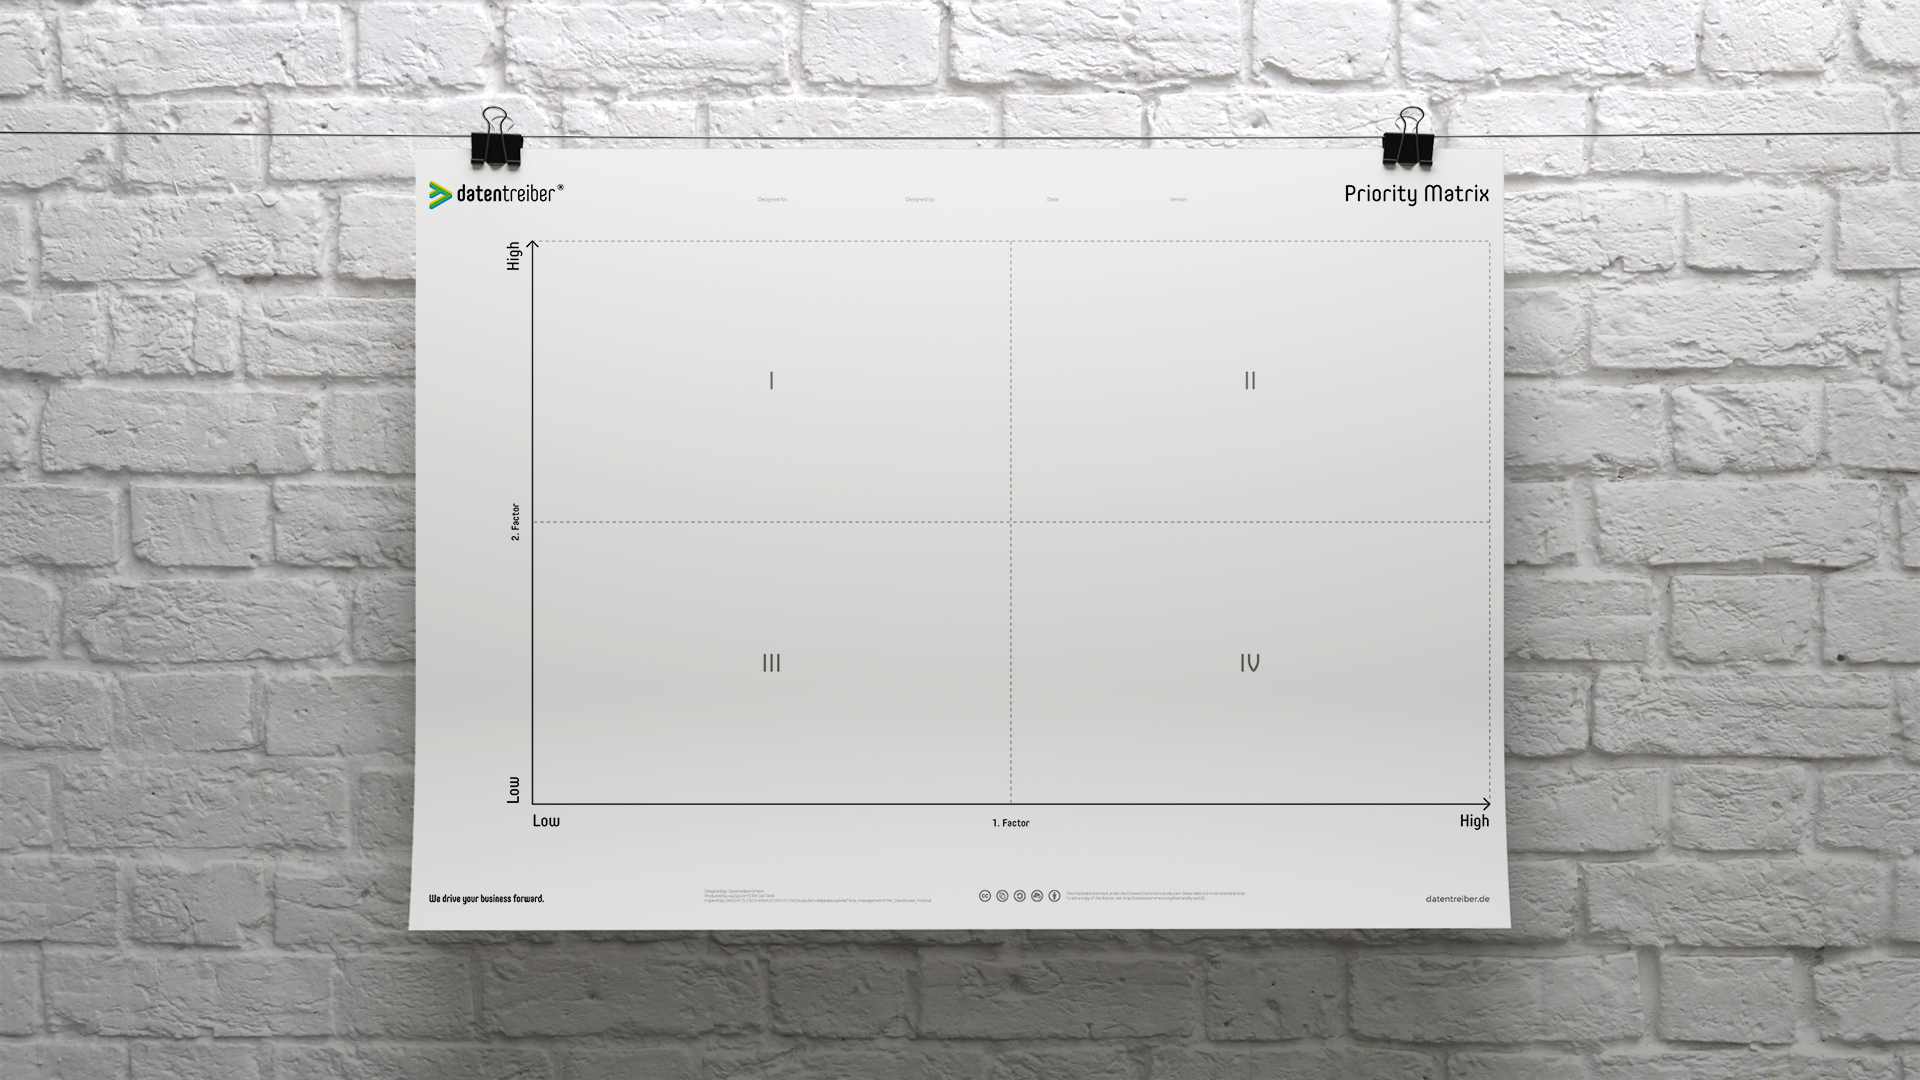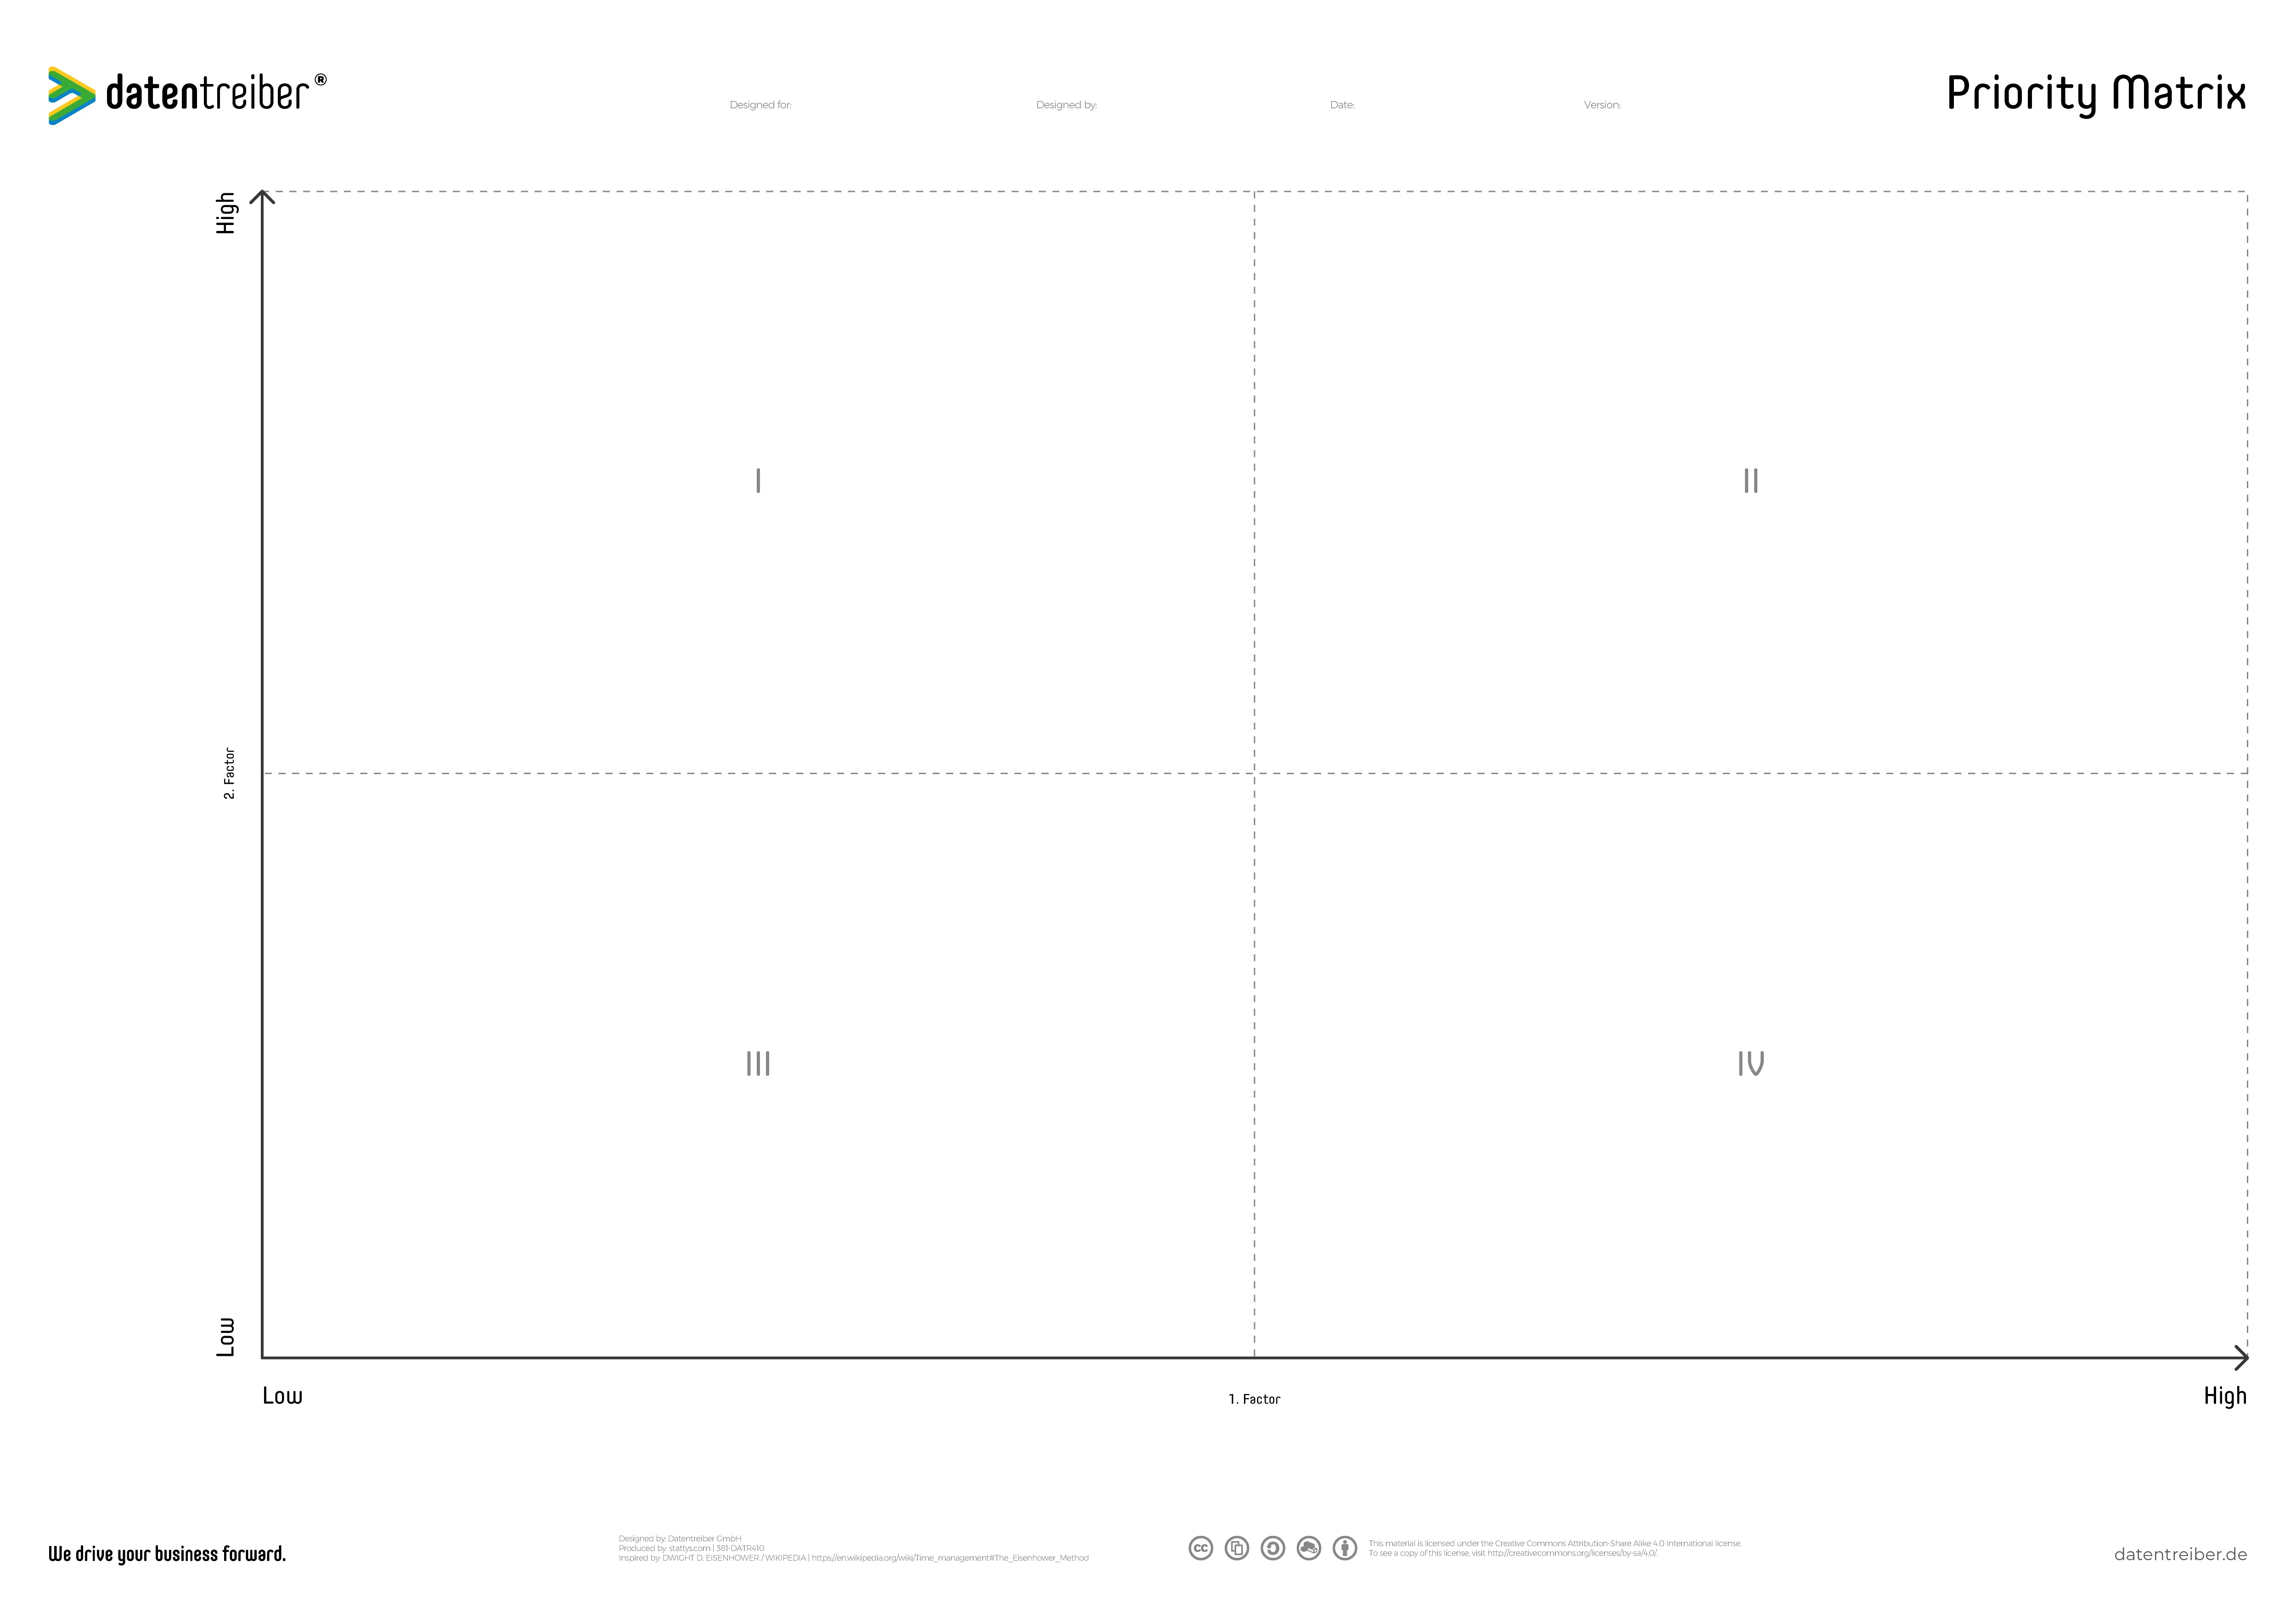
Priority Matrix Canvas
Using the Priority Matrix Canvas you can quickly and easily get to informed and transparent decisions within your team workshop. The visual prioritization tool helps you for example to focus on the right ideas, problems or solutions.
We drive your business forward.
What Is the Priority Matrix Canvas?
The Priority Matrix Canvas is a generic prioritization tool that allows you to assess ideas, problems, solutions, etc. based on two factors and subsequently to focus on the critical elements. By doing so you can freely choose the factors along both axes. One example would be the prioritization of projects based on the cost-benefit ratio: projects are ordered according to estimated costs on the x-axis and the expected benefit on the y-axis. In this case, the focus lies on the upper left quadrant (marked with “I”): there you can find the projects with low costs and high value.
The Priority Matrix Designkit Canvas is available for free under a Creative Commons license: you may use and modify the canvas as long as you cite Datentreiber in particular as the source.
We drive your business forward.

We drive your business forward.
Stay Focused on the Relevant and Important Tasks, Projects and Ideas.
The Priority Matrix helps you to select the most relevant and important options out of all possible ideas, tasks, projects, or other items by letting you first visually sort all items according to two dimensions (for example sorting tasks according to importance and urgency). Afterward, you can focus on the items in one of the quadrants, for instance, the ones in the upper right one. Make use of the Priority Matrix to clearly communicate and document decisions based on objective criteria.
For more information, see Data Strategy Design.
Start
The starting position for the Priority Matrix is a collection of ideas, tasks, or other items which have been for example collected by a team during brainstorming. Examples are:
- possible products or services on an Analytics Use Case
- data-driven use cases as part of a Data Strategy
- possible optimizations of Customer Touchpoints
- tasks to be done
The next step is to identify, out of all these ideas and/ or tasks, the ones to which the team should dedicate its future attention and time.
For this, you need to define two factors together with the team which determine the prioritization. Afterward, you label the axes of the Priority Matrix (left side & lower side) with cards respectively.
Examples of prioritization factors are:
- for tasks: urgency and importance
- for ideas: feasibility and (positive) impact
- for projects: costs and benefits
If there are more than two proposals for suitable factors, just let the team vote and select the two most voted factors.
Step 1 of 2
First Card
Now place the first card exactly in the middle of the Priority Matrix where the four quadrants (I, II, III, and IV) meet.
Ask the team: “How does this task/idea do regarding the first factor? Above or below average?” Move the card on the X-axis accordingly until the team agrees on its horizontal position.
Proceed with the second factor and its vertical position in the same way, meaning to position it on the Y-axis accordingly.
Step 2 of 2
Second, Third, and Further Cards
Repeat this procedure (questioning and positioning of the card as described above) for every further idea or task. If the team is not sure about a card’s position, you can ask: “How do you evaluate the current card’s position relative to the first, second, and so forth card, regarding the first and respectively the second factor?”
It’s crucial that the cards’ relative position reflects the teams’ assessment.
Completion
Therefore, at the end of the process when all ideas, tasks, etc. have been placed on the Priority Matrix, you should (again) ask the question if every card’s position does reflect its relative position compared to the others. If necessary you need to readjust a card’s position. Finally, you select those cards which should be the team’s focus during the rest of the workshop. Usually, those are the cards in the upper right quadrant (number II), for instance, the tasks with high importance and high urgency.
In case there are no cards in this quadrant, just choose the cards in the lower right one (number IV) or the cards in the upper left one (number I) as an alternative.
We drive your business forward.
Where Can I Find More Information?
Here you can find further documentation:
Step-by-step-guide (Canvas Generation)
Instructions manual (Stattys)
We drive your business forward.
How Can I Start?
Seminars

Get to know our Data Strategy Design Method in our practical seminars:
- For beginners: Data Strategy & Culture
- For rising stars: Data Design Thinking
- For advanced designers: Data Business Consulting
Cross References

Here you can find further canvas and information concerning Data Strategy Design:
License Terms

You are free to:
Share — copy and redistribute the canvas in any medium or format
Adapt — remix, transform, and build upon the canvas
for any purpose, even commercially.
Under the following terms:
Attribution
ShareAlike
We drive your business forward.
Subscribe to our newsletter:
Receive all relevant blog articles, new seminar dates, special conference offers and much more conveniently by email. As a welcome gift, we will send you a link to download our Datentreiber design book (in German) and, for a short time, the article ” Data Thinking: mehr Wert aus Daten” in PDF form after your registration.
By clicking ‘Subscribe to our newsletter’ you agree that we process your information in accordance with our privacy policy.


