Customer Touchpoints Canvas
Using the Customer Touchpoints Canvas you can identify the relevant touchpoints with your customers and analyze the potential customer processes. This visualization tool helps you to conceptualize successful customer journeys as well as to gauge the customer paths and to optimize them.
We drive your business forward.
What Is the Customer Touchpoints Canvas?
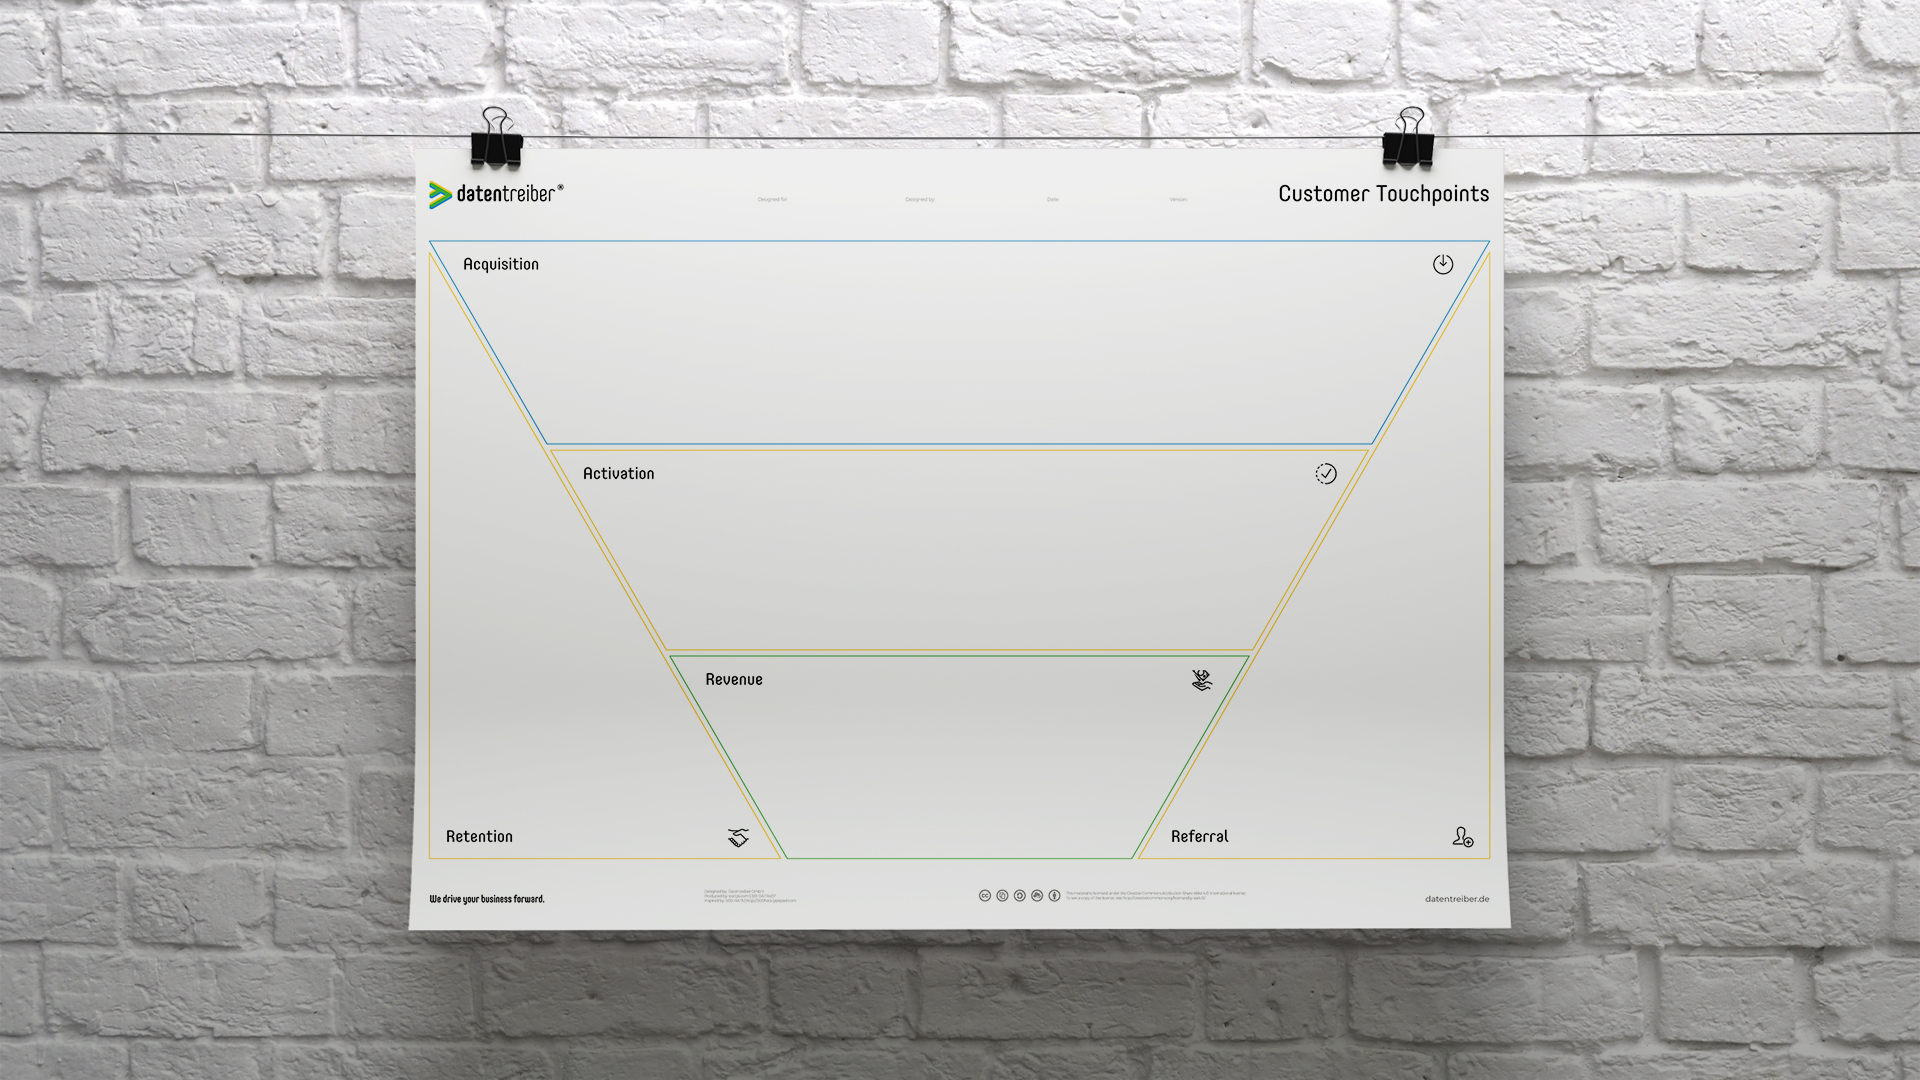
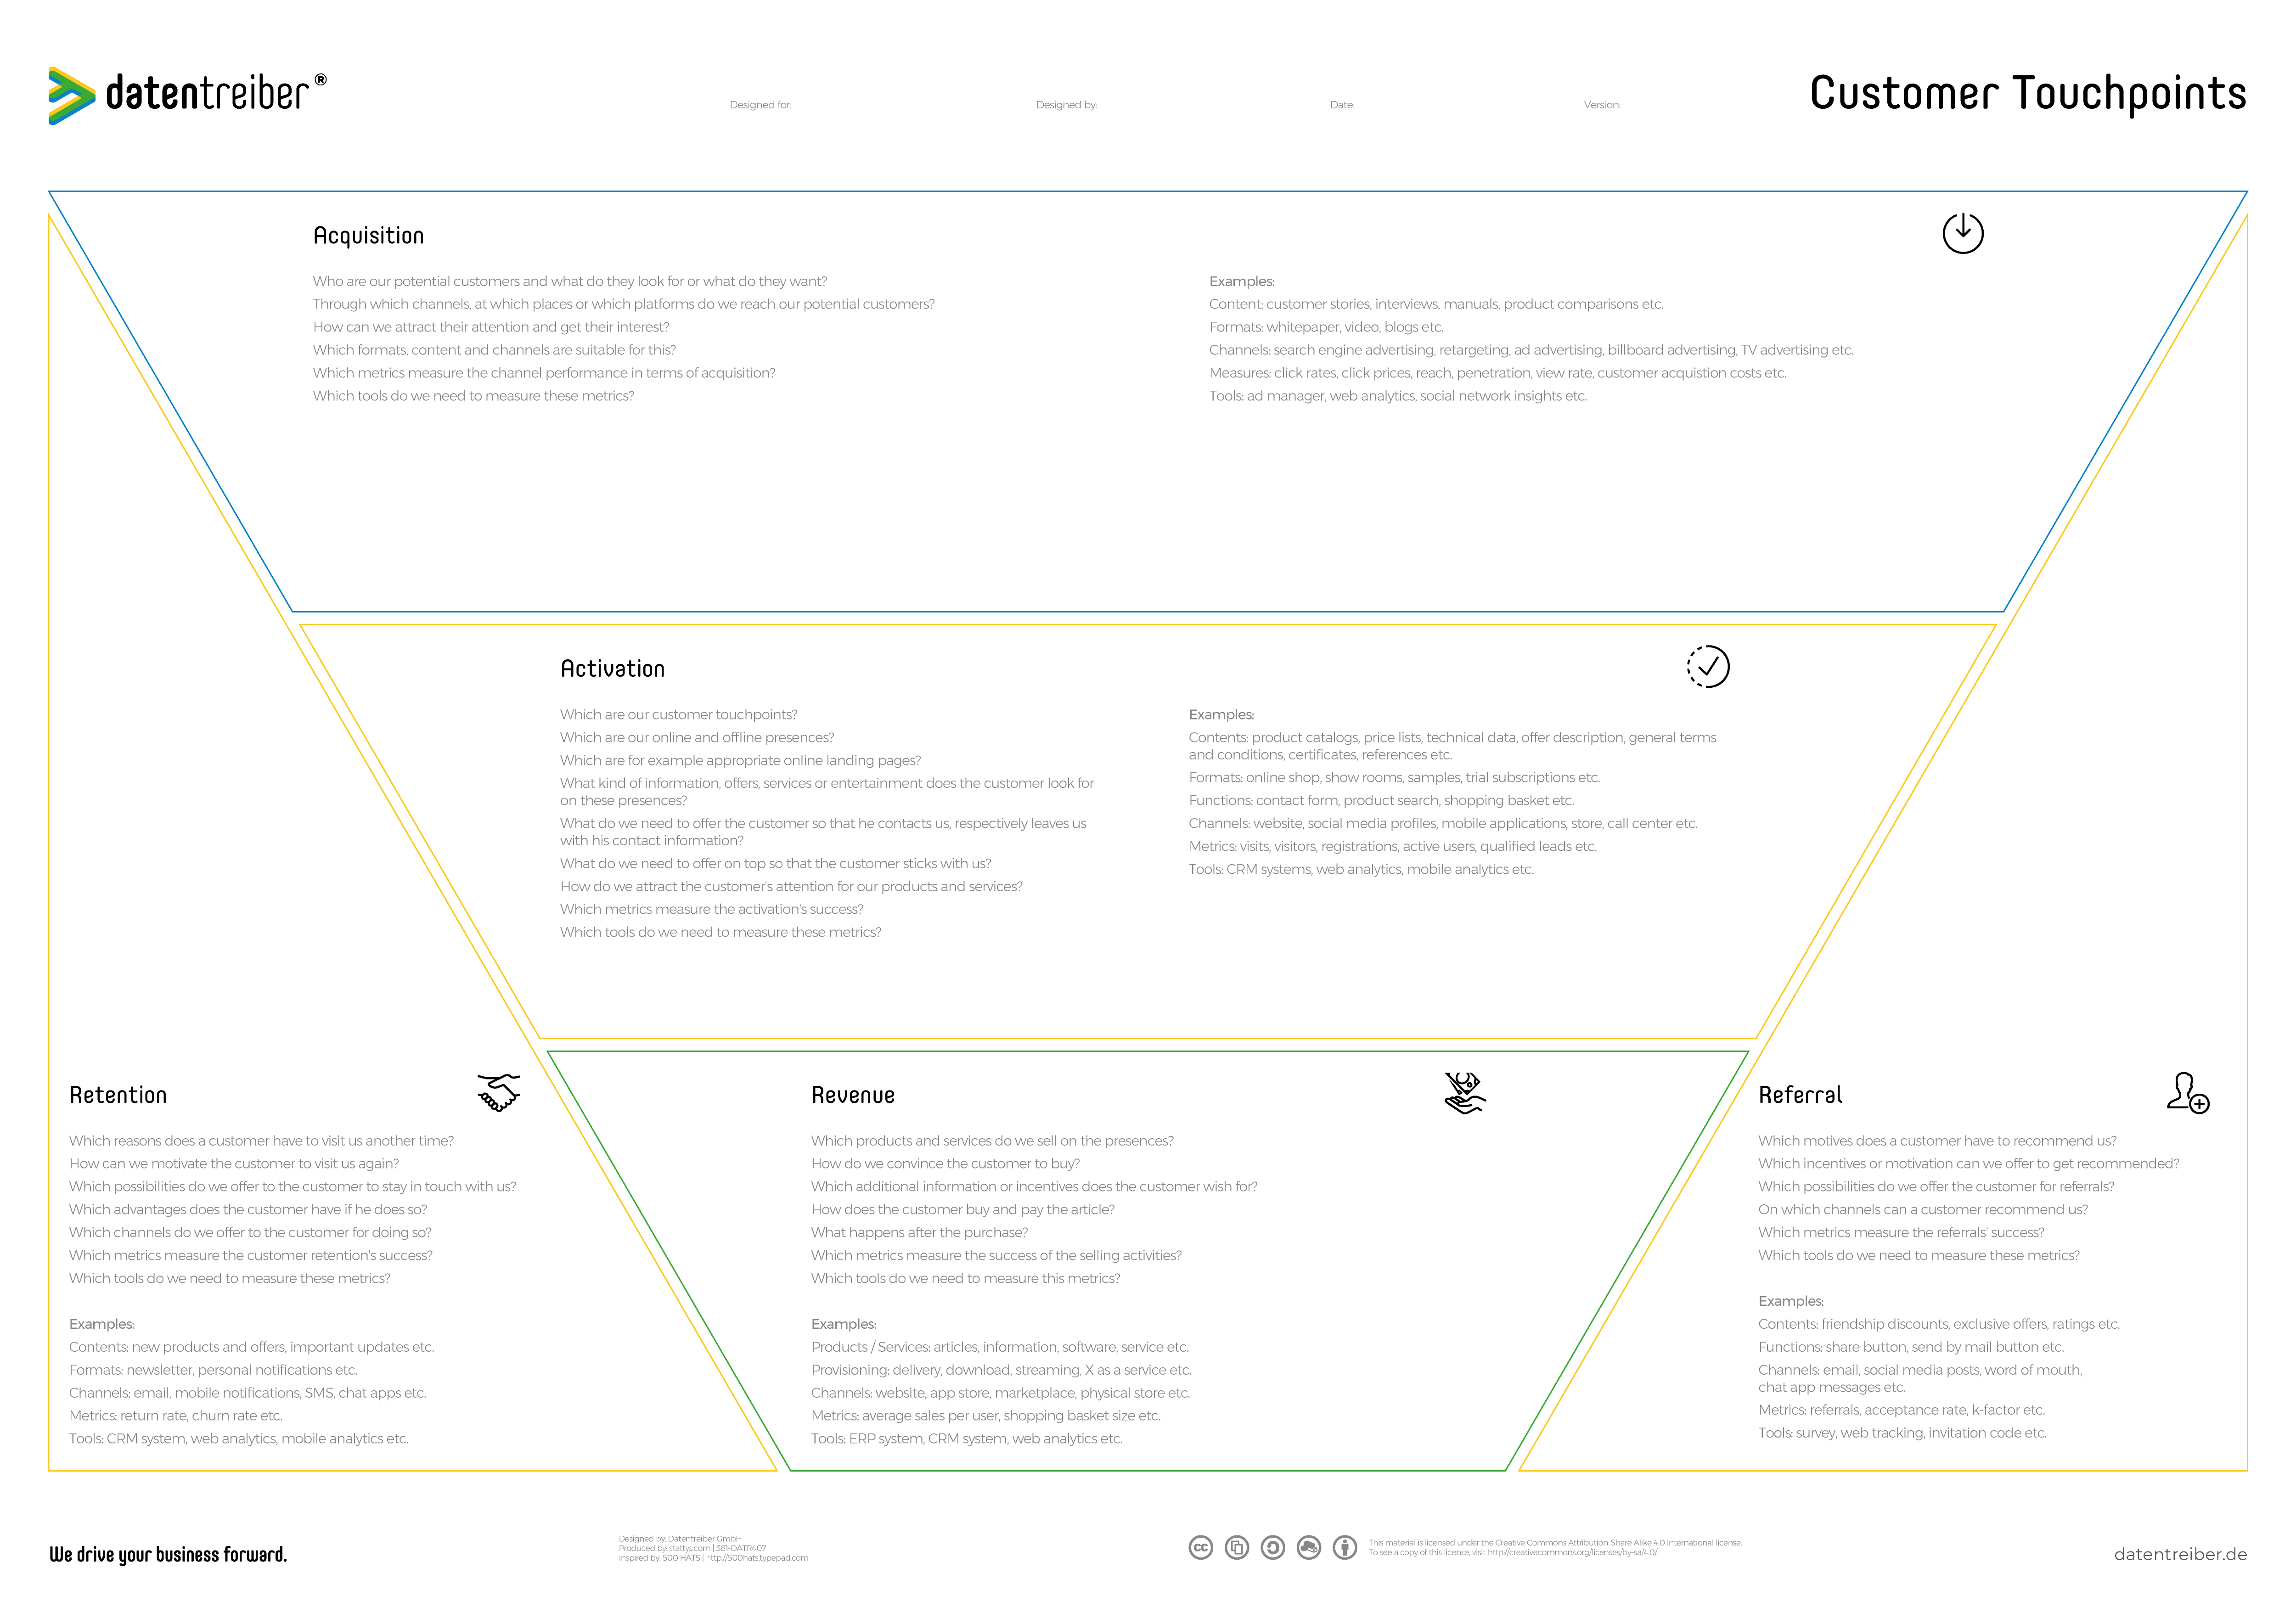
The Customer Touchpoints Canvas builds the foundation for successful data-driven marketing by helping you to understand your marketing and sales activities from the customers’ point of view and to improve them. For doing so the template divides the customer journey into five phases:
- Acquisition: through which channels and throughout which campaigns do we create attention for our brands?
- Activation: at which customer touchpoints and with which offers do we convince the prospective buyers of our products and services?
- Revenue: which are the relevant sales channels through which our customers acquire our products and services?
- Retention: how do we establish a long-term relation to the prospective buyers and customers?
- Referral: which possibilities and means do we offer prospective buyers and customers to share our offers with their contacts?
The Customer Touchpoints Canvas is available for free under a Creative Commons license: you may use and modify the canvas as long as you cite Datentreiber in particular as the source.
We drive your business forward.

We drive your business forward.
How Do I Use The Customer Touchpoints Canvas?
The Customer Touchpoints canvas fits several use cases:
- Plan your marketing and sales activities, your online presence and / or your advertisements and check your plan regarding consistency and plausibility
- Sketch out potential customer journeys to identify logical breaks, bottlenecks, dead ends or gaps in your offering.
- Define relevant performance indicators including critical points for monitoring them.
- Identify potential sources for customer data.
Learn more about the Data Strategy Design method.
Start
You can use the Customer Touchpoints Canvas either way: to document the current state of your marketing and sales activities and channels, to design their target state, or you combine both together. You can do this for your company as a whole or for single products only. You can also focus only on certain aspects (channels, content, performance indicators, etc.) or look at several aspects at once. This solely depends on your objective when using the canvas. For example, if you would like to define performance indicators to measure the performance of certain marketing and sales channels, you should only document the current state of the channels, and when looking at the target state, focus on the performance indicators.
Always start with the current state before turning to the target state. On top of that, ask yourself which content (for example, product information or offers) a user is expecting in which phase of the customer journey. Only then think about suitable formats and channels for this content. Afterward, you can define performance indicators that depend on the selected channels and choose the right tools to measure success. Write each answer on one card. Further down in this tutorial you’ll also find some questions which can guide you throughout the described process.
Use different colors for different status and / or aspects, for example:
- Green: existing channels, content, etc.
- Red: missing channels, content, etc.
- Yellow: content and features
- Blue: channels and formats
- White: performance indicators and tools
Either start with the (customer) acquisition or with the revenue. The starting point only depends on what’s easier for you. Work yourself from the top to the bottom or vice versa and from the left to the right through all boxes. The boxes correspond to the phases of a customer journey and reflect the mental context of a user (please see also the following abstracts).
Step 1 of 5
Aquisition
During the acquisition phase the company, brand, or product is might not yet be known to the customer. Maybe he or she also has no desire or need for the products and services of your company. Hence, you need to attract his / her attention and interest.
Questions:
- Who are our potential customers and what do they want or search for?
- On which channels, places or via which platforms can we reach our potential customers?
- How can I attract their attention and get their interest?
- Which formats, content and channels are suitable?
- Which performance indicators measure the success according to the respective channel?
- Which tools do we need to measure these performance indicators?
Examples:
- Content: customer stories, interviews, manuals, product comparisons, etc.
- Formats: white paper, video, blogs, etc.
- Channels: search engine advertising, retargeting, display, poster or TV advertising, etc.
- Performance indicators: click rates, click prices, reach, coverage, viewing rate, customer acquisition costs, etc.
- Tools: ad manager, web analytics, social network insights, etc.
Step 2 of 5
Activation
A customer enters the activation phase after he or she has been acquired (acquisition), referred by friends (referral), or brought back by a customer retention measure (retention). This phase mainly deals with convincing customers of the company’s products and services as well as moving them towards an active examination of the offers. This is also called activation.
Questions:
- Which are our customer touchpoints?
- Which online and offline presences do we offer?
- What are for example suitable online landing pages?
- Which information, offers, services or entertainment does the customer look for on those presences?
- What do we need to offer to the customer so that he / she is contacting us or leaving us with his / her contact data?
- What do we need to offer on top so that customers stay with us?
- Which performance indicators measure the activation success?
- Which tools do we need to measure these performance indicators?
Examples:
- Content: product catalog, price lists, technical information, offer description, general terms and conditions, certificates, references, etc.
- Formats: online shop, show rooms, product samples or subscriptions, etc.
- Features: contact form, product search, shopping basket, etc.
- Channels: web page, social media profile, mobile applications, store, call center, etc.
- Performance indicators: visitors, registrations, active users, qualified leads, etc.
- Tools: CRM systems, web analytics, mobile analytics, etc.
Step 3 of 5
Retention
Customer retention helps to increase the duration of the customer relationship. It does not matter whether the customers are paying customers or customers only using or consuming a service. That’s because many free-to-play / free-to-use offers on the internet are based on the mechanic that the costs for offering an online service (e.g., an online game) are very low compared to the customer acquisition costs. Therefore it’s worth keeping a customer active until he / she is ready to pay for (extra) services.
Questions:
- Which reasons does a customer have to revisit us?
- How can we motivate him / her to revisit us?
- Which possibilities do we offer the customer to stay in contact with us?
- Which advantages does the customer have doing so?
- Which channels do we offer the customer for this?
- Which performance indicators measure the success of the customer retention?
- Which tools do we need to measure these performance indicators?
Examples:
- Content: new products and offers, important updates, etc.
- Formats: newsletter, personal notifications, etc.
- Channels: mail, mobile notifications, SMS, chat apps, etc.
- Performance indicators: return rate, churn rate, etc.
- Tools: CRM system, web analytics, mobile analytics, etc.
Step 4 of 5
Revenue
Generating revenue with the customer is the customer touchpoints’ objective. This revenue can be generated on your own presence (e.g. online shop) or in other / foreign platforms (e.g., marketplace). Revenue can be direct (sale) or indirect (commission). It can be transaction-based (e.g., product price) or transaction-independent (e.g., a monthly subscription fee).
Questions:
- Which products and services do we sell on the presences?
- How do we convince the customer to buy?
- Which additional information or incentives does the customer desire?
- How does the customer buy and pay for the products / services?
- What happens after the sale?
- Which performance indicators measure the success of sales?
- Which tools do we need to measure these performance indicators?
Examples:
- Products / services: goods, information, software, service, etc.
- Provisioning: delivery, download, streaming, X-as-a-service, etc.
- Channels: web page, app store, marketplace, store, etc.
- Performance indicators: average revenue per user, shopping basket size, etc.
- Tools: ERP system, CRM system, web analytics, etc.
Step 5 of 5
Referral
Non-paying users who are recommending the company’s products and services to other prospects are as important as paying customers because they attract new customers with their referrals. They help to reduce customer acquisition costs. Hence, it’s important to not only win paying customers but also social media followers as brand ambassadors and product recommenders.
Questions:
- Which reasons does a customer have to recommend our company?
- Which incentives can we offer for recommendations or how can we motivate customers to recommend us?
- Which possibilities do we offer customers for recommendations?
- On which channels can a customer give a recommendation?
- Which performance indicators measure the referral success?
- Which tools do we need to measure these performance indicators?
Examples:
- Content: friendship discounts, exclusive offers, ratings, etc.
- Features: share button, send by mail button, etc.
- Channels: mail, social media posts, word of mouth, news in chat apps, etc.
- Performance indicators: recommendations, acceptance rate, k-factor, etc.
- Tools: survey, web tracking, invitation code, etc.
Completion
Step one step back after you have run through all boxes respectively phases of the customer journey and ask yourself: are the journeys the customer can take consistent and efficient? Are there any logical breaks, dead ends, bottlenecks, or gaps? Here are some negative examples:
- You are advertising with content on foreign web pages to acquire customers but this content cannot be found on your own web page or is hidden on sub pages.
- You are acquiring users on social media channels but these users do not convert to web page visitors.
- You are losing many customers on the way to a sale on your web page because the (click) distance is too long.
- You are advertising online but your customers are not able to reach you offline.
Derive some concrete next steps after removing these weak points:
- Where is potential for further optimization?
- Which content, formats or channels etc. are missing?
- Which performance indicators do we need to measure and analyze?
- Which tools do we need to implement?
When aiming for data-driven solutions, it’s good practice to develop a respective Data Strategy as well as to prioritize use cases accordingly depending on their Analytics Maturity. To define the relevant content, features, and formats, it’s advisable to work with the Value Proposition Template. The results of this template can be transferred to a Business Model / Case (in terms of a channel). Finally, data points can be derived from the Customer Touchpoints Canvas and located in the Data Landscape.
We drive your business forward.
Where Can I Find More Information?
The presentation referred to beside introduces you to the Data Strategy Design method and Customer Touchpoints Canvas by means of an example project.
Here you can find further documentation:
Messen Sie was zählt wo es zählt (Blog)
Mit Design Thinking zur erfolgreichen Customer Journey (SlidesLive: Folien & Video)
Design Thinking zur Optimierung der Customer Journey (SlideShare)
Instructions manual (Stattys)
Data Thinker Group (LinkedIn)
The Customer Touchpoints Canvas is geared to the AARRR-Modell – also called “Pirate Model”. The following SlideShare presentation provides an introduction to it: Startup Metrics for Pirates.
We drive your business forward.
How Can I Start?
Seminars

Get to know our Data Strategy Design Method in our practical seminars:
- For beginners: Data Strategy & Culture
- For rising stars: Data Design Thinking
- For advanced designers: Data Business Consulting
Cross References

Here you can find further canvas and information concerning Data Strategy Design:
License Terms

You are free to:
Share — copy and redistribute the canvas in any medium or format
Adapt — remix, transform, and build upon the canvas
for any purpose, even commercially.
Under the following terms:
Attribution
ShareAlike
We drive your business forward.
Subscribe to our newsletter:
Receive all relevant blog articles, new seminar dates, special conference offers and much more conveniently by email. As a welcome gift, we will send you a link to download our Datentreiber design book (in German) and, for a short time, the article ” Data Thinking: mehr Wert aus Daten” in PDF form after your registration.
By clicking ‘Subscribe to our newsletter’ you agree that we process your information in accordance with our privacy policy.


