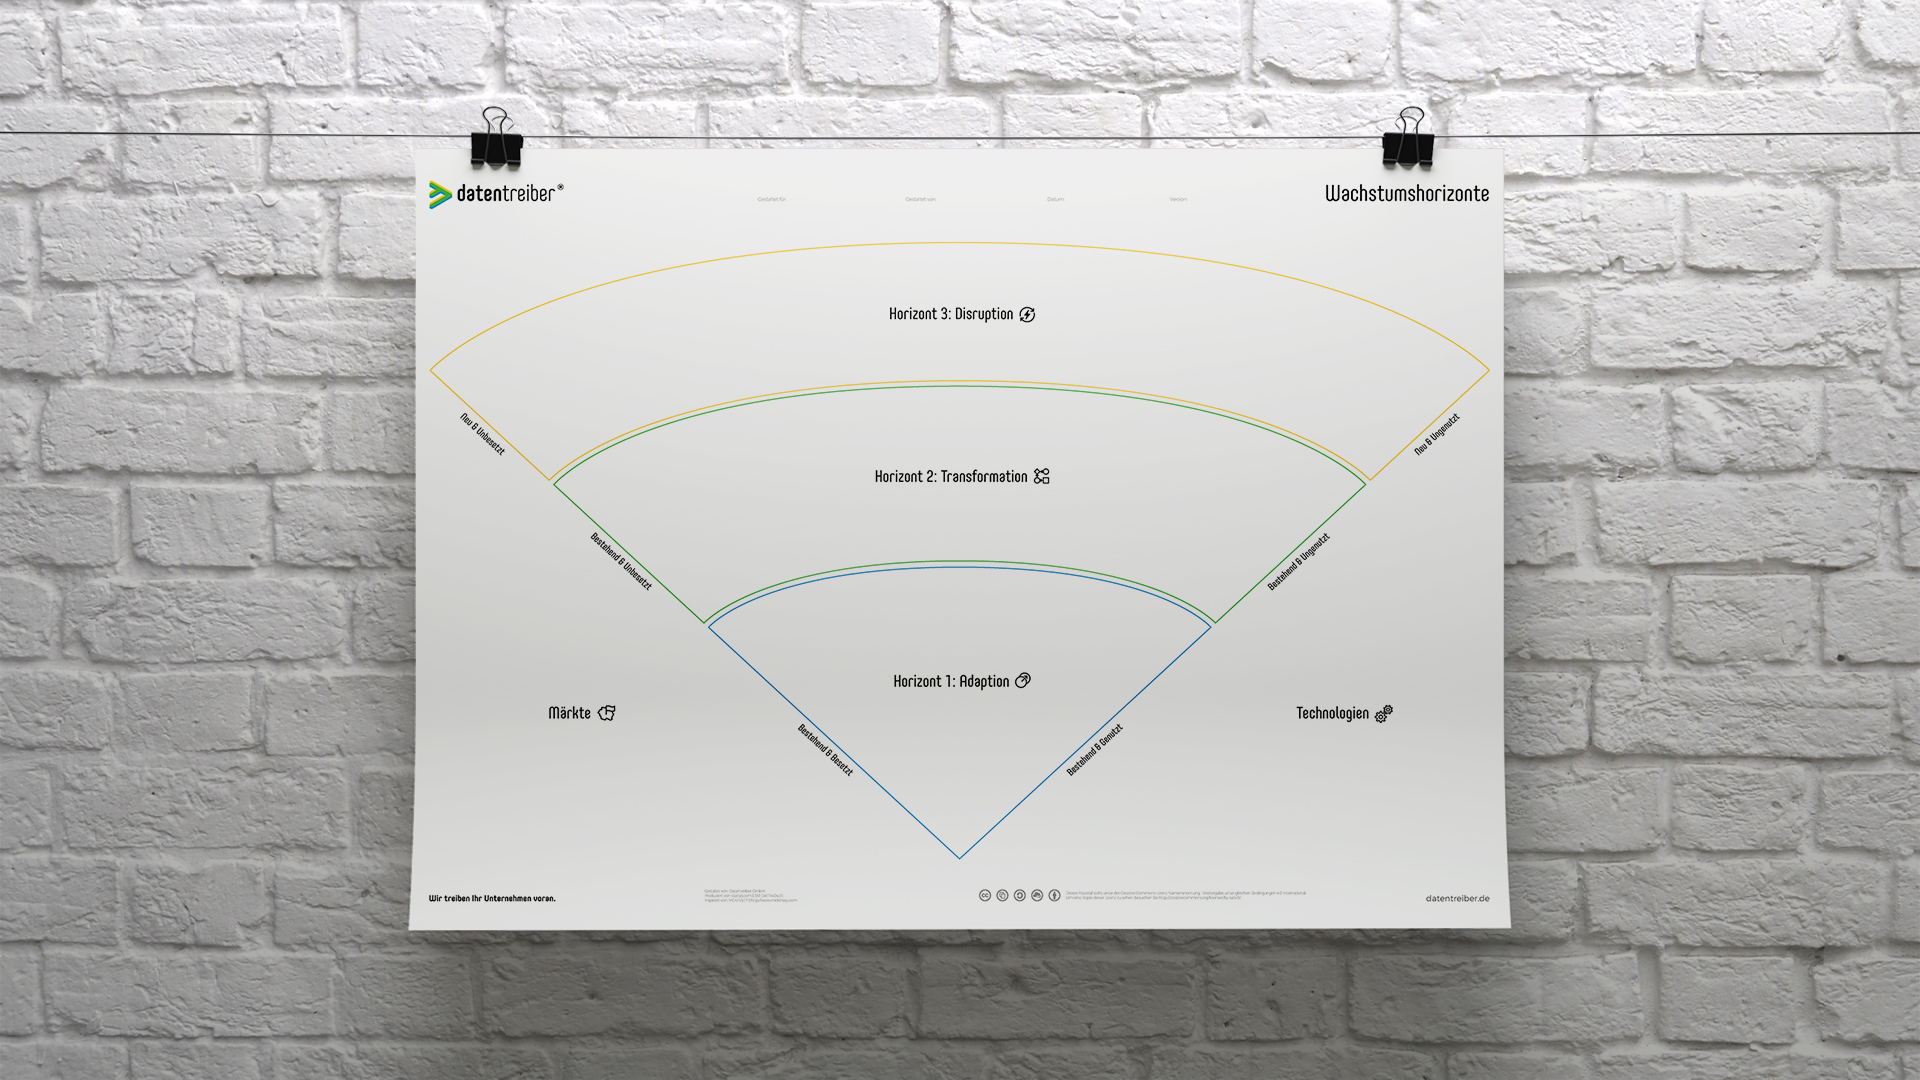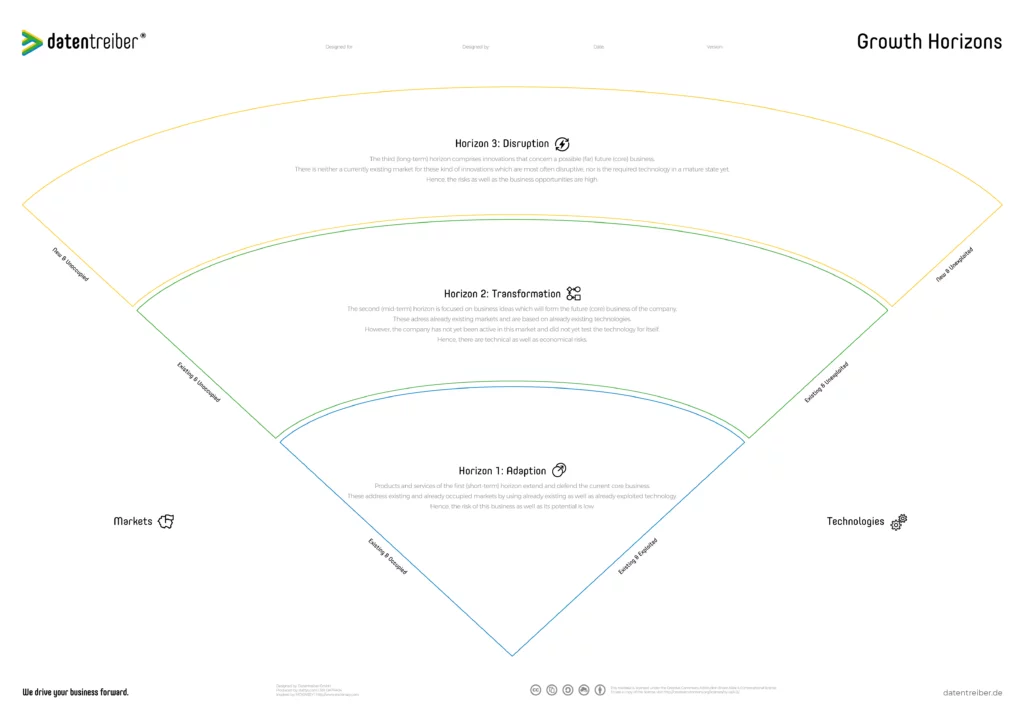
Growth Horizons Canvas
Using the Growth Horizons Canvas you can arrange innovations based on their marketability and technological maturity. The prioritization tool helps you to focus at the right point in time on the short-, mid- and long-term business ideas.
We drive your business forward.
What Is the Growth Horizons Canvas?
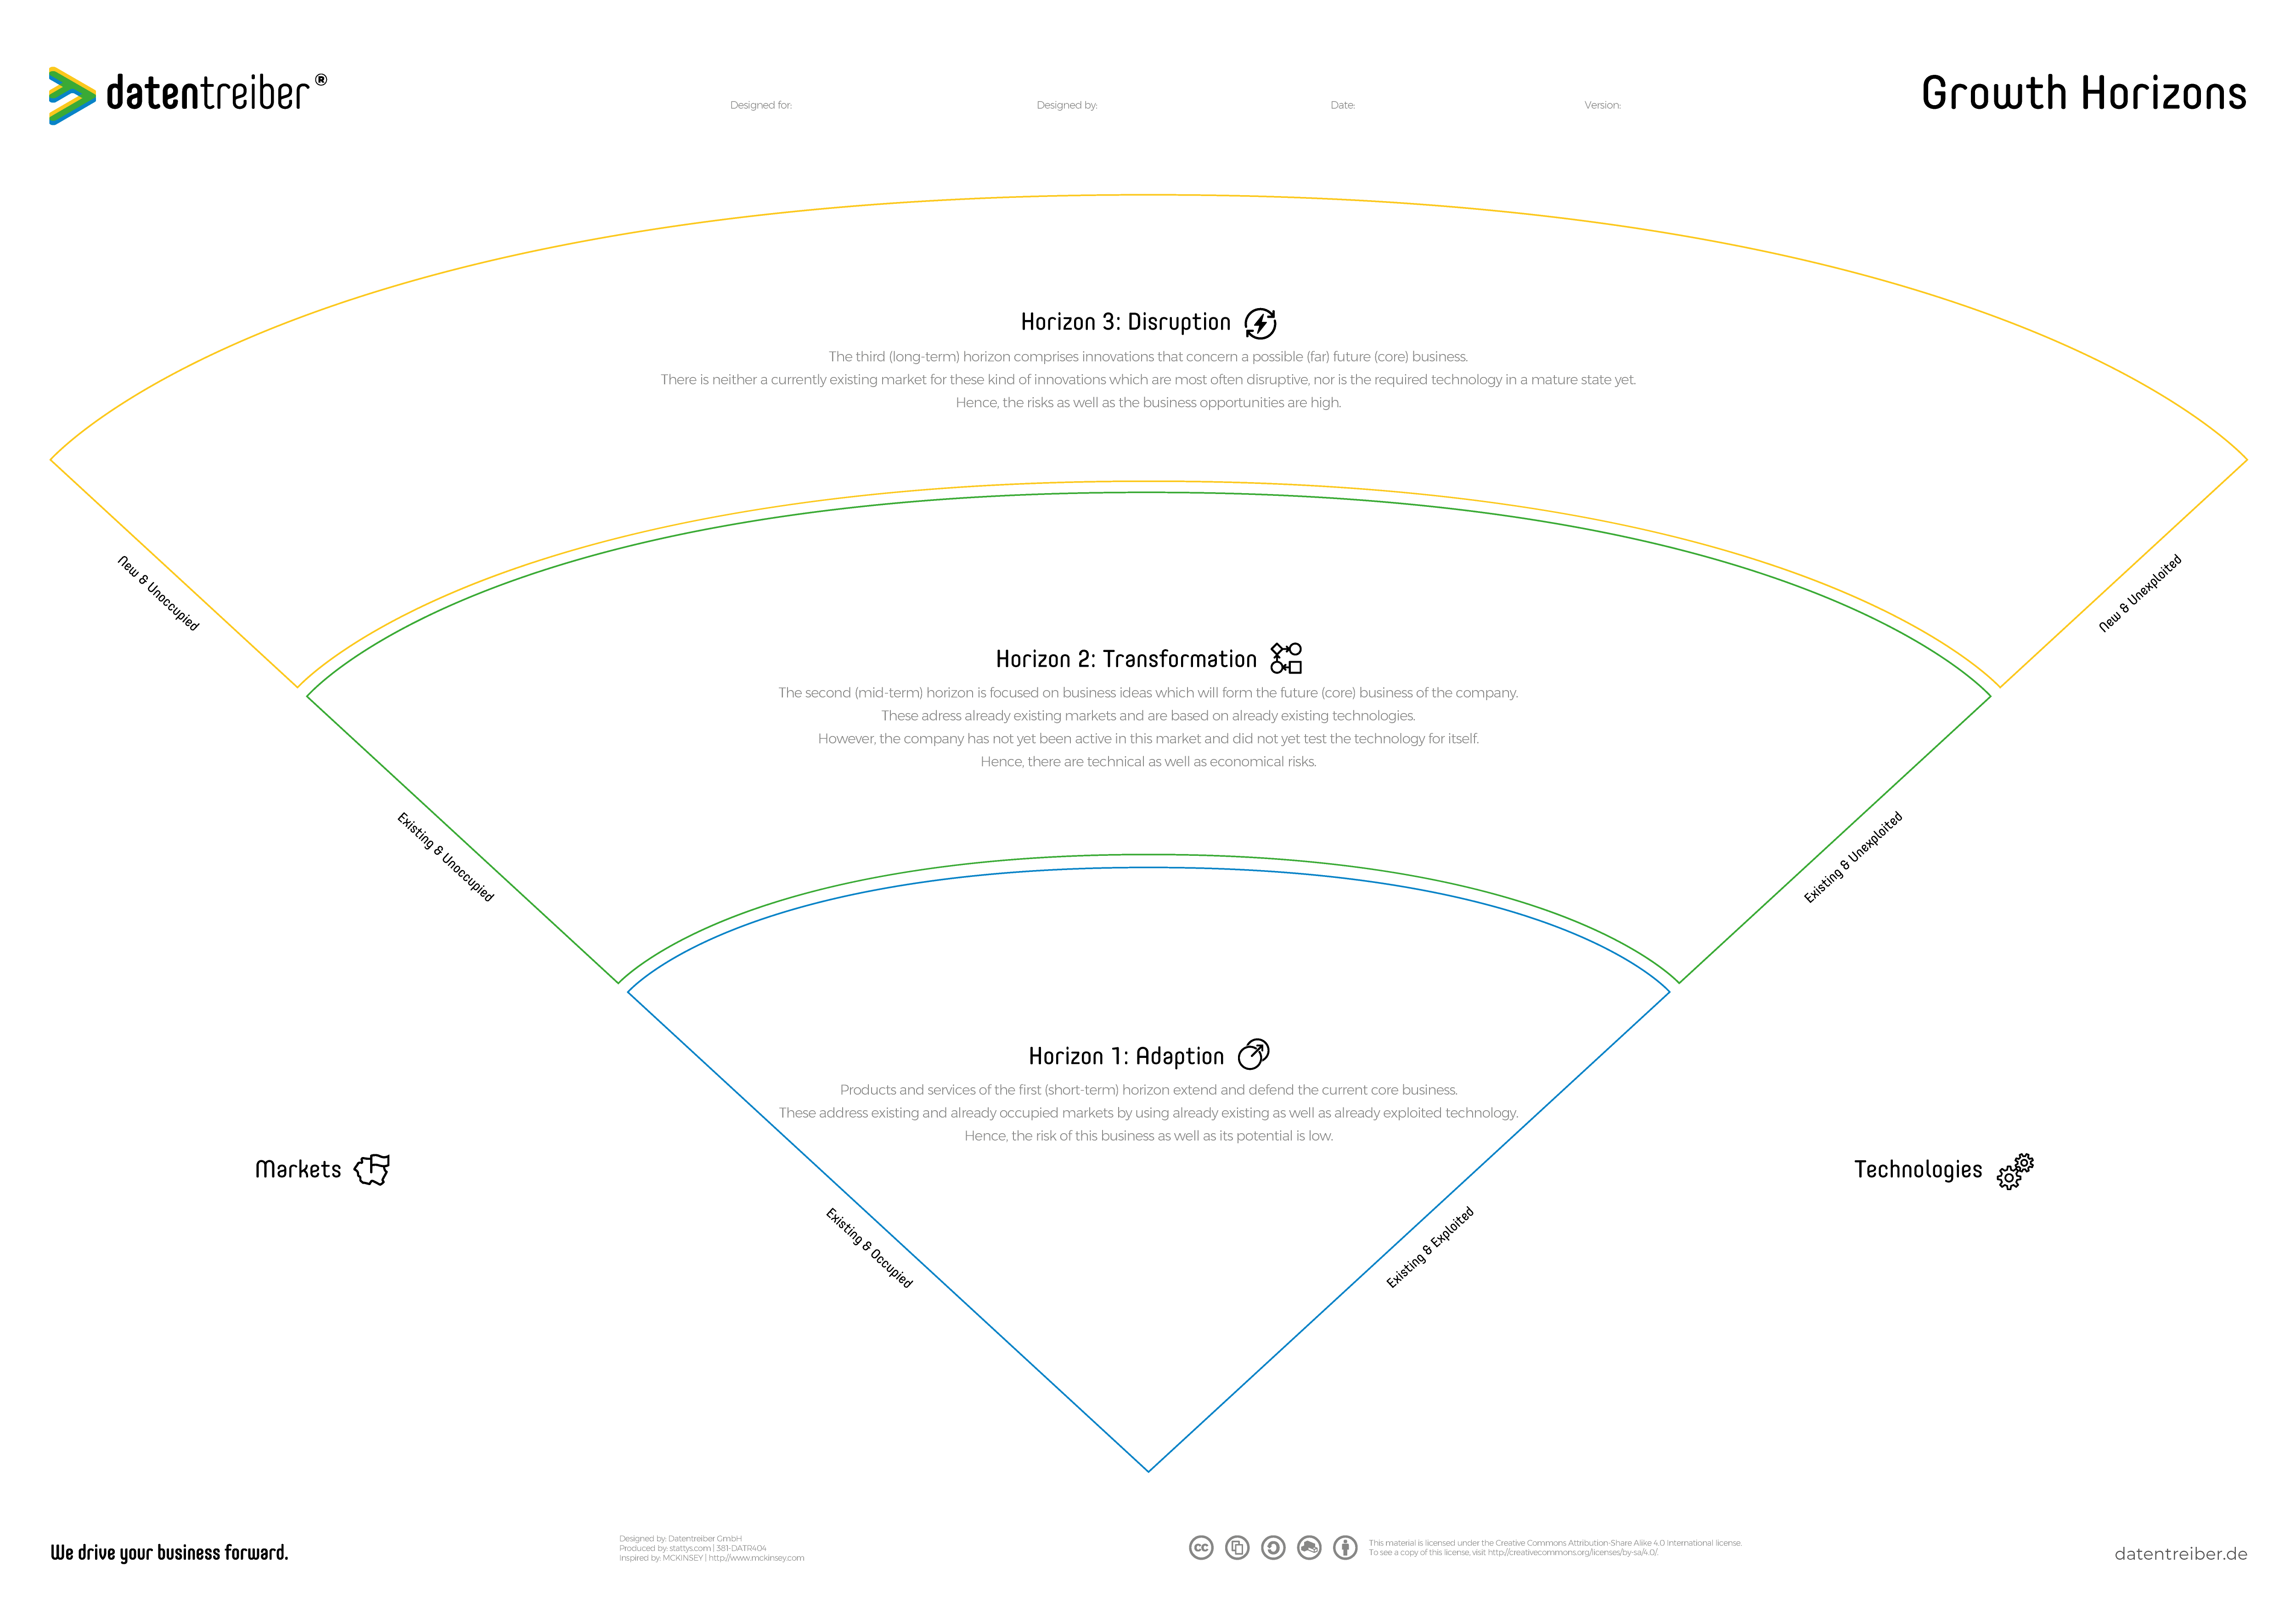
Companies that want to grow need to tap into new markets or develop new products. The Growth Horizons Canvas arranges respective business ideas according to their growth perspective and doing so thereby also differentiates between three-time horizons:
- Adaption: the short-term horizon “H1” focuses on innovations which defend the core business as well as to extend it and which address already occupied markets and also use already proven technologies.
- Transformation: the mid-term horizon “H2” emphasizes on innovations which prepare the future core business and which target existing but not yet occupied markets as well as which require existing but not yet applied technologies.
- Disruption: the long-term horizon “H3” deals with ideas which could completely replace the core business in the future and for which there is no existing market yet as well for which the required technologies are not yet mature enough.
The Growth Horizons Canvas is available for free under a Creative Commons license: you may use and modify the canvas as long as you cite Datentreiber in particular as the source.
We drive your business forward.

We drive your business forward.
How Do I Use the Growth Horizons Canvas?
Using the Growth Horizons canvas you can systematically explore new growth markets and new technologies. It helps you to answer the following questions:
- In which order should we tackle innovation projects?
- Which time horizon do the respective innovations have?
- In which technological environment and market do the innovations exist?
For more information, see Data Strategy Design.
Start
The starting point for working with the Growth Horizons canvas is a collection of ideas for innovative products and solutions. To develop such ideas you can either use the Business Model / Case Canvas or the Analytics Use Case Canvas. Often the ideas are manifold: they can be incremental product improvements or even completely new, innovative products for which there is no market existing yet and the required technology is still being developed. The growth horizons help you to sort these ideas according to the time horizon as well as their growth potential.
Step 1 of 2
Axes
The canvas respectively defines two time axes:
- Markets: companies can operate in existing and known markets or explore new markets which are either already developed or just now being developed.
- Technologies: to be able to offer new products and services in these markets, companies can either make use of existing and known technology or use new technology which is either mature or not yet proven.
Step 2 of 2
Horizons
Furthermore, the canvas includes three boxes for locating the ideas according to their respective growth horizons:
- H1 covers business ideas that help to improve the existing core business of the company in the short-term and to defend it against its competitors. The ideas address existing and known markets and they are based on existing and known technologies. The objective is to adapt the company to the state of the art in terms of technology and economy.
- H2 stands for transformation. This means business ideas that will be the company’s core business in the mid-term. Indeed those ideas target already existing markets but markets in which the company is not yet active. The same is true for the technologies which are necessary for the ideas’ realization: these might already exist but the company is not yet using them.
- H3 finally comprises those long-term ideas which are called disruptive. Those technologies have not yet been proven and the markets have not yet been developed. Accordingly, the risk is high but the same is true regarding the potential for business.
Run through your collected ideas one by one and locate each business idea according to its technological as well its technical maturity on both (diagonal) axes markets and technologies. The assignment to a growth horizon can be derived accordingly.
For example: a business idea that uses a new and not yet proven technology in order to create an offer in an already existing market in which the company is not yet active needs to be located in horizon H3 according to this scheme.
Completion
After you have placed all ideas on the respective growth horizons, you can prioritize them. Use for example the Priority Matrix canvas to rate the ideas according to their economic value and their technological effort for instance. Doing so you should always only compare ideas located on the same horizon against each other: the potentials and efforts for H1, H2, and H3 ideas are very different from each other. Hence, they are not comparable which is also true regarding their risks and uncertainties. Growth horizon H3 for example is located – speaking of time – in a very far distant future. Therefore the ideas in this horizon are still somehow blurry. Whereas the H1 ideas are directly in front of you only waiting to be realized.
Outlook
When realizing the ideas you should first focus your efforts on the short-term ideas coming from H1 in order to optimize your core business. However, still keep an eye on the H2 ideas to prepare their realization respectively: by doing conceptual work, market analysis, prototyping, etc. Finally, you still have to keep in mind the H3 ideas and follow up on them. This is important to start timely with realizing those in order to be prepared as soon as the markets and technologies are mature enough.
We drive your business forward.
Where Can I Find More Information?
Here you can find further documentation:
Data Thinker Group (LinkedIn)
The Growth Horizons Canvas is based on the Three Horizons Framework by McKinsey.
We drive your business forward.
How Can I Start?
Seminars

Get to know our Data Strategy Design Method in our practical seminars:
- For beginners: Data Strategy & Culture
- For rising stars: Data Design Thinking
- For advanced designers: Data Business Consulting
Cross References

Here you can find further canvas and information concerning Data Strategy Design:
License Terms

You are free to:
Share — copy and redistribute the canvas in any medium or format
Adapt — remix, transform, and build upon the canvas
for any purpose, even commercially.
Under the following terms:
Attribution
ShareAlike
We drive your business forward.
Subscribe to our newsletter:
Receive all relevant blog articles, new seminar dates, special conference offers and much more conveniently by email. As a welcome gift, we will send you a link to download our Datentreiber design book (in German) and, for a short time, the article ” Data Thinking: mehr Wert aus Daten” in PDF form after your registration.
By clicking ‘Subscribe to our newsletter’ you agree that we process your information in accordance with our privacy policy.


