Data Strategy Designguide Canvas
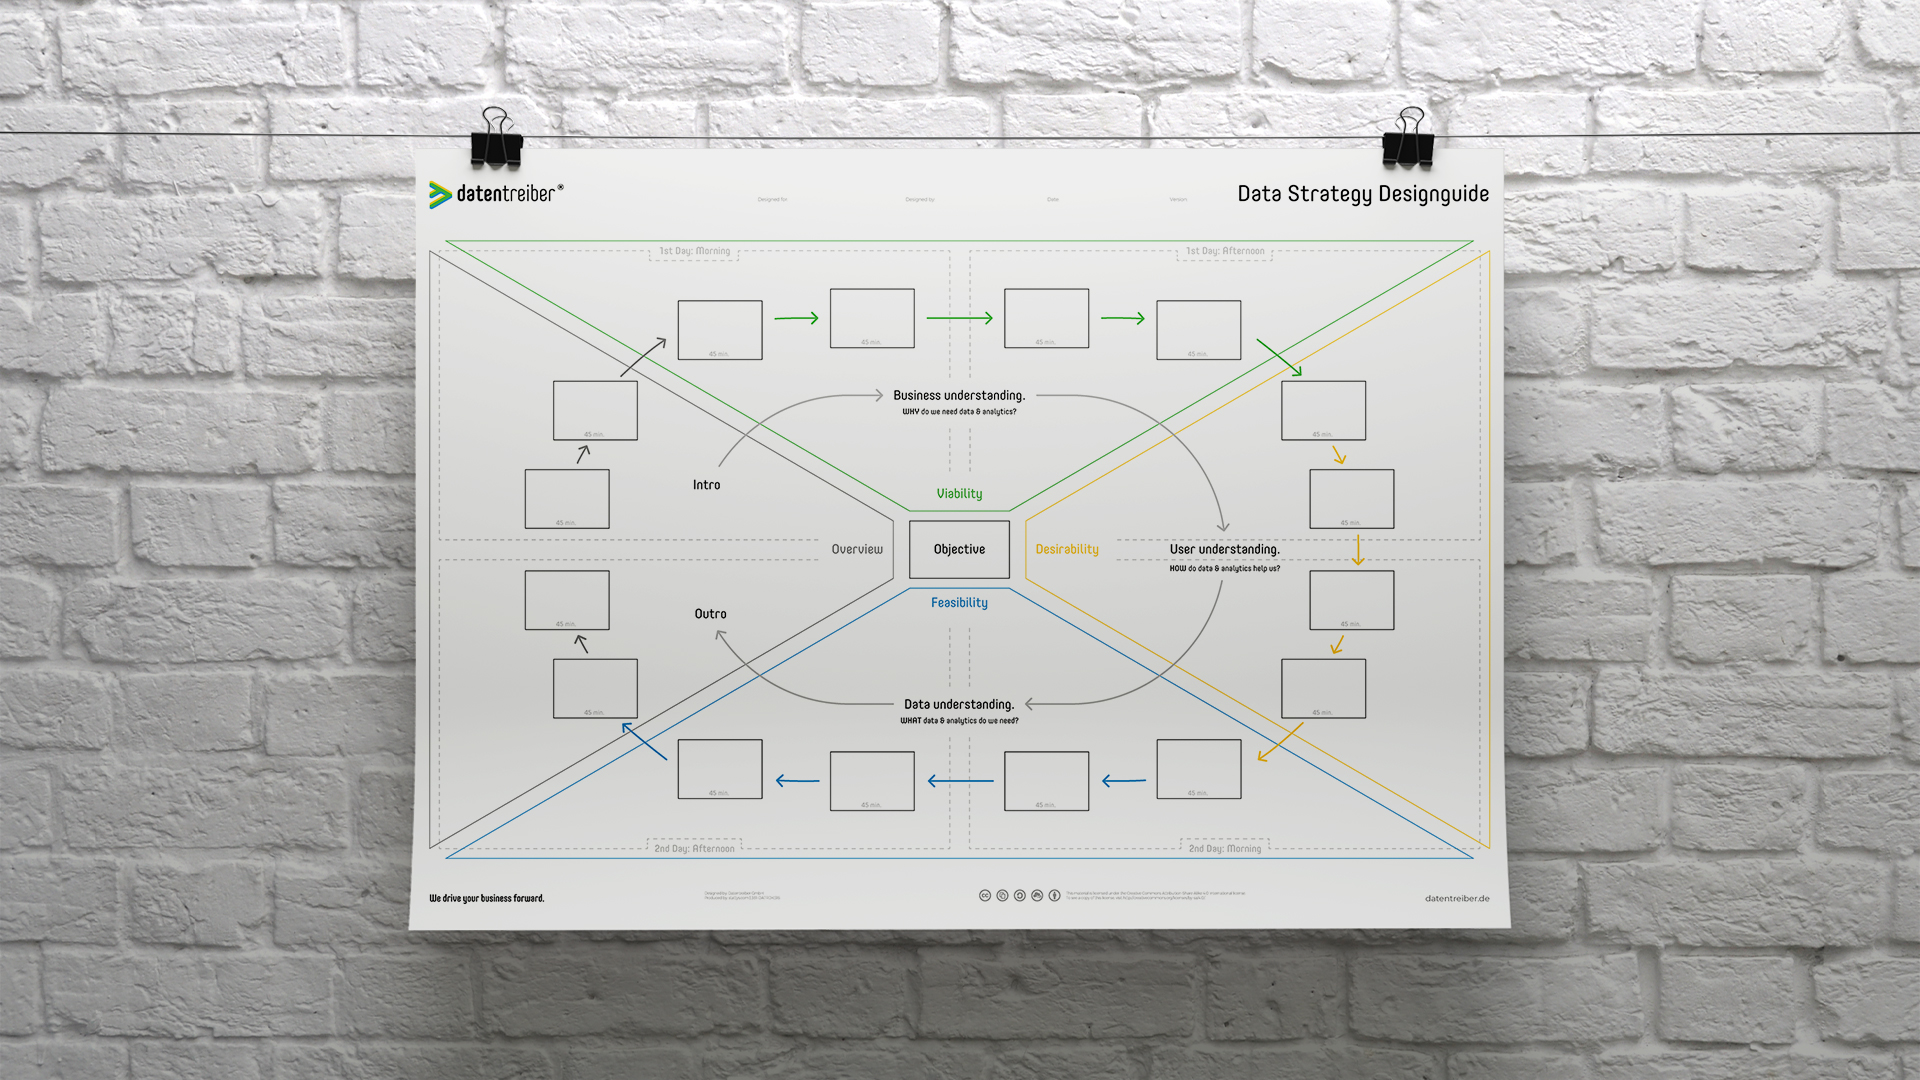
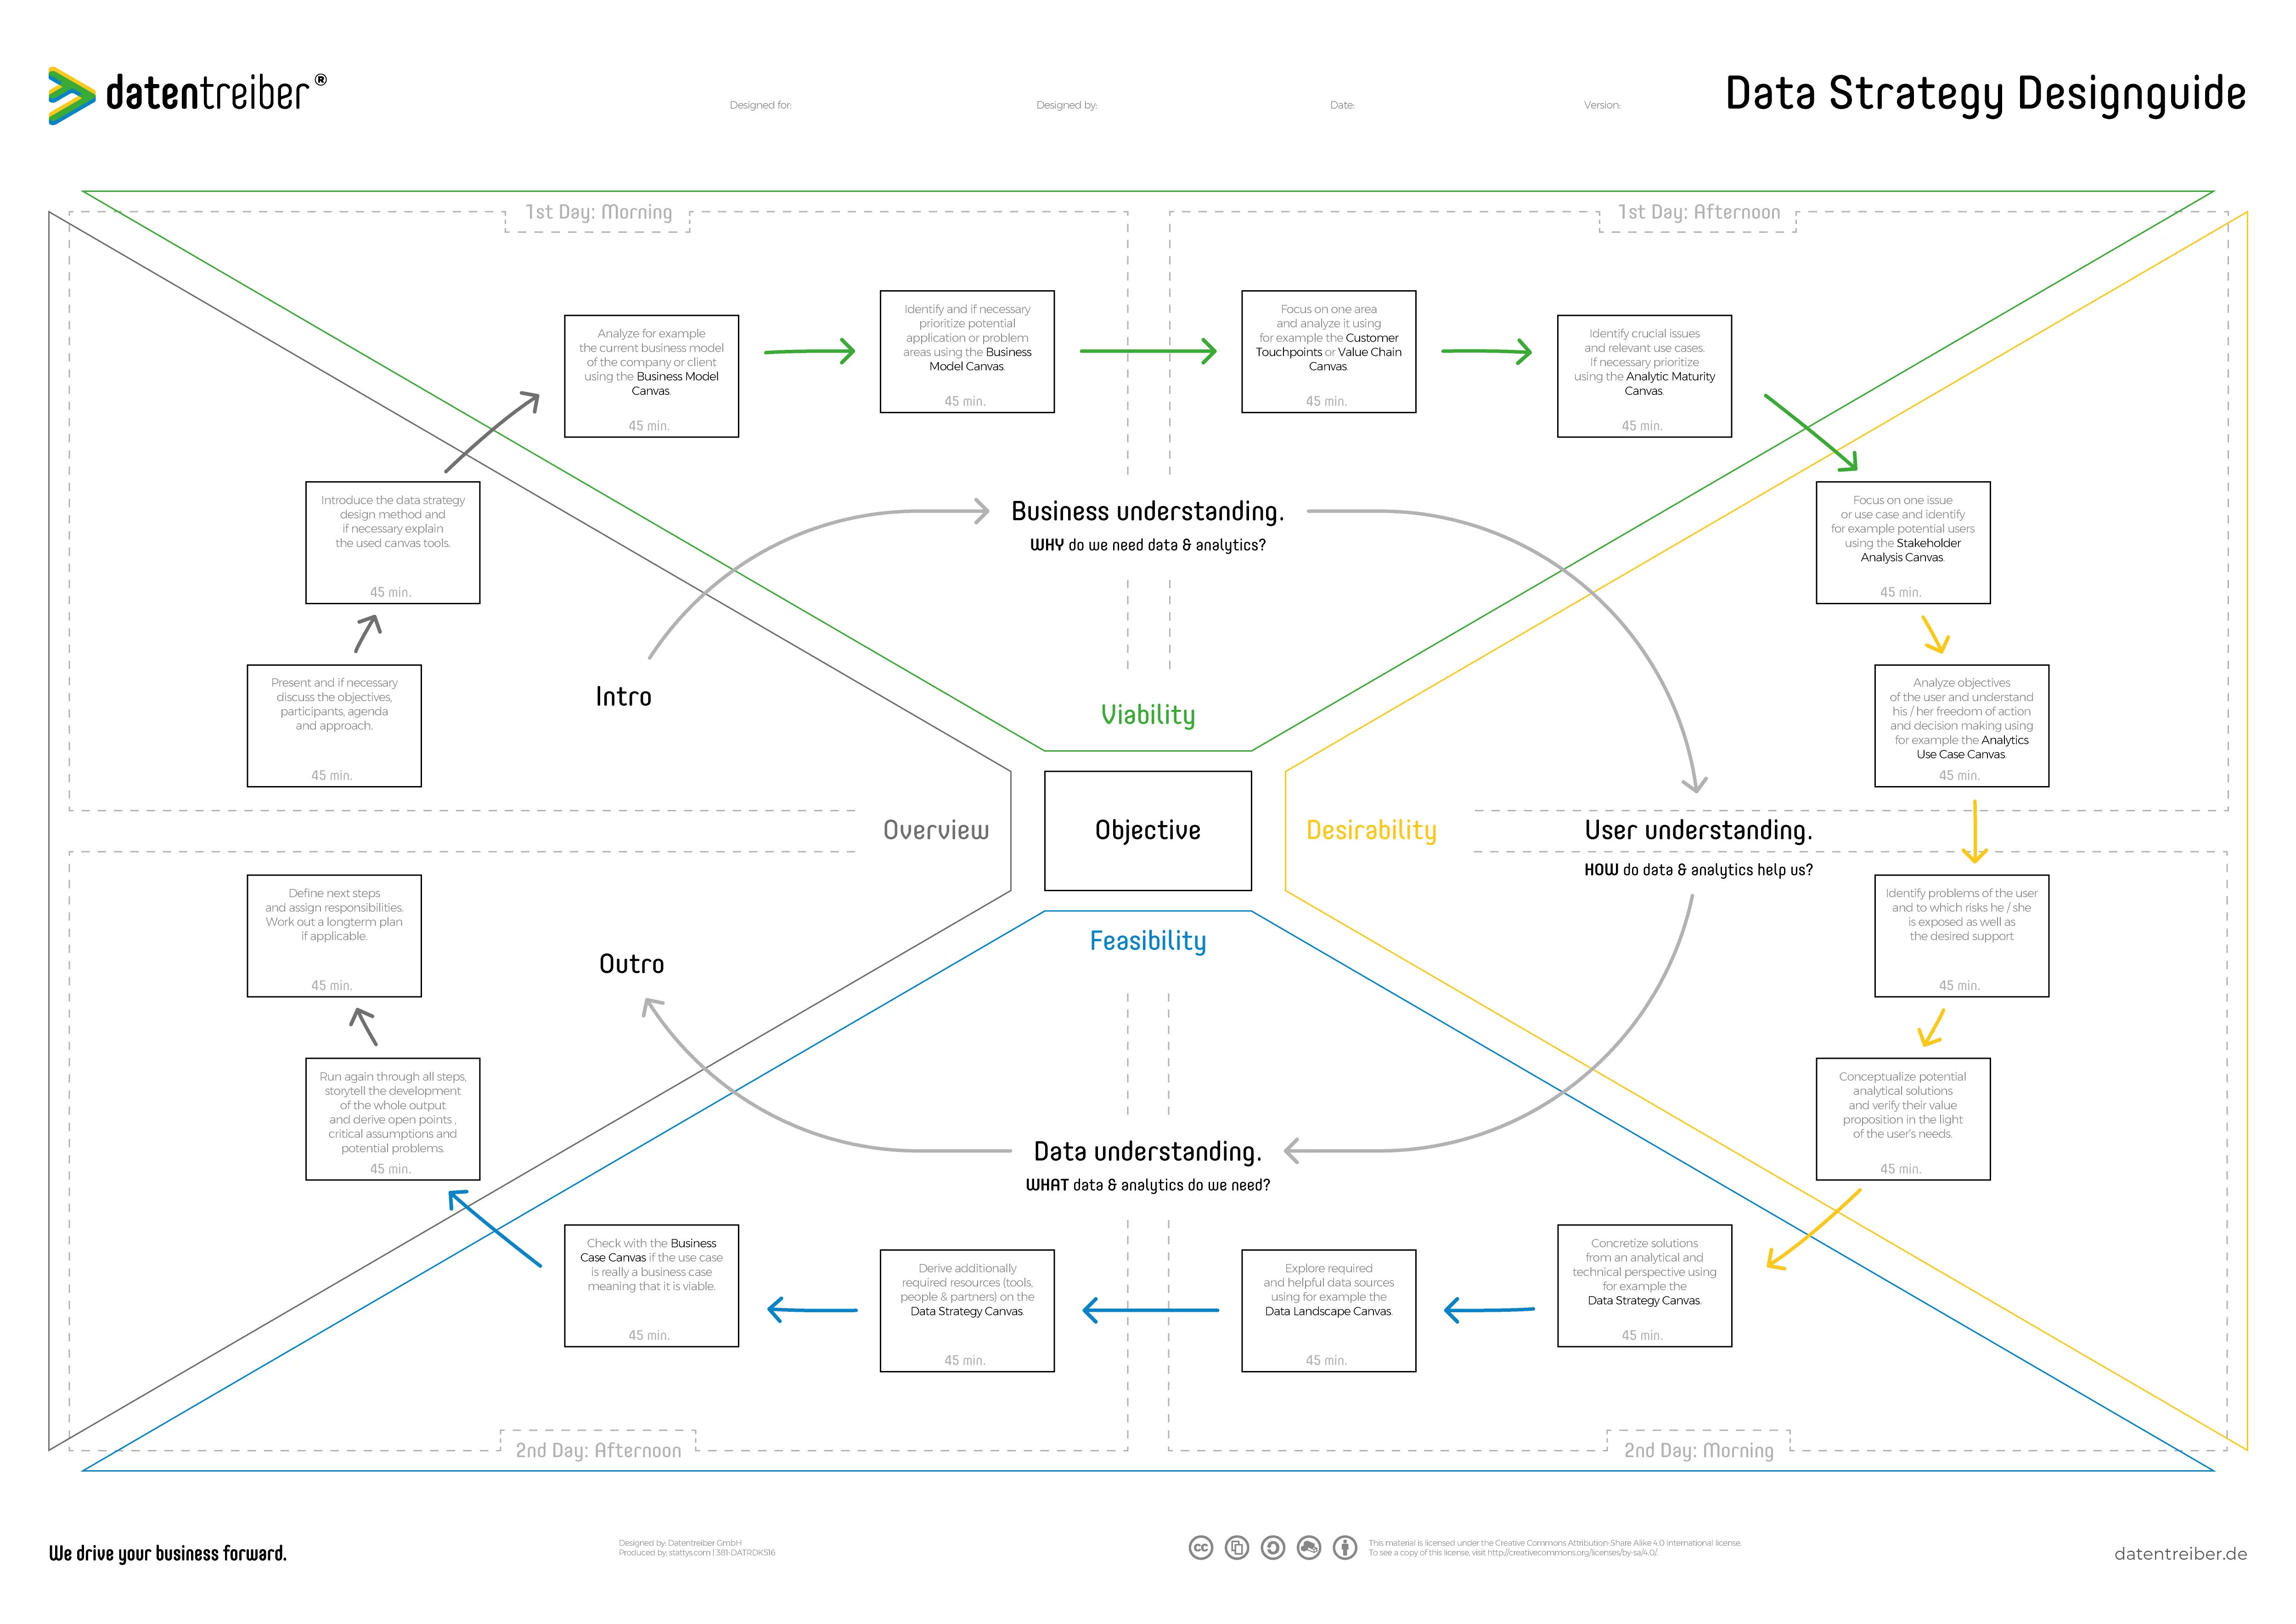
Using the Data Strategy Designguide Canvas you can plan and visualize the approach used within a data strategy or data product design workshop. Starting from an objective the tool helps you to define the required steps and to discuss these within your team if necessary.
We drive your business forward.
What Is the Data Strategy Designguide Canvas?
The Data Strategy Designguide Canvas is a planning tool for data strategy and data product workshops. It divides a one- or two-day workshop into phases with two to four time slots of 45 minutes each and helps you to reach your objectives within the workshop’s time. The five phases are:
- Intro: to present objectives, agenda and participants as well as to introduce the method and the tools.
- Business understanding: to ensure that your data strategy and data products have a financial benefit.
- User understanding: to ensure that your data strategy and data products are desired by the users.
- Data understanding: to determine that you have the required data and analytics to implement the data strategy and data products.
- Outro: to summarize the results and to plan the next steps.
The Data Strategy Designguide Canvas is available for free under a Creative Commons license: you may use and modify the canvas as long as you cite Datentreiber in particular as the source.
We drive your business forward.

We drive your business forward.
Plan and Illustrate Your Data Strategy Workshops.
The Data Strategy Design Method allows you to design and plan your company’s or your customer’s data strategy and data products:
- Develop internal analytics solutions to foster data driven decisions.
- Automate your company’s processes using data driven methods.
- Conceptualize new data driven products for your customers.
- Model data driven business models.
For this, the Data Strategy Designkit provides you with the required tools to work jointly on your data strategy and analytics projects in interdisciplinary teams. Good practice is to do this in one- or two-day workshops.
With the Data Strategy Designguide Canvas you have another tool in your belt helping you to prepare the workshops and to illustrate the workshops’ process of data strategy design to the workshop’s participants. The design guide guides you and your team through the design phase to create successful data innovations.
A successful innovation has to meet three criteria:
- Viability: using analytics to exploit data needs to be done in an economical way. Therefore you need to understand the (economic) potential of data & analytics.
- Desirability: the analytics’ potential users need to have the desire to use the solutions. If not there is no benefit in data and analytics. Therefore you need to know the users, their objectives as well as their needs and problems.
- Feasibility: you need to have the required data, (analytics) tools as well as the skills to develop and operate the solutions.
Subsequently, the designguide divides the process into the phases business understanding, user understanding and data understanding. Doing so its oriented towards the Cross-Industry Standard Process for Data Mining (CRISP-DM), However, it extends the data understanding and the business understanding with the user understanding (this follows the Design Thinking view).
In the public project Datenstrategie-Designguide you can find different canvas for numerous recurring workshop formats.
Start
Before starting to work with the canvas ask yourself the following questions:
I. What’s the workshop’s objective?
- Is it to develop a data and analytics strategy for the company as a whole (vision)?
- Is it to identify for one functional area the critical analytics use cases for the company’s data?
- Is it to conceptualize a concrete use case and to evaluate if it’s a business case?
Place the objective (blue card) in the middle of the canvas.
II. Who are the workshop’s participants, respectively who should participate?
- Who are the analytics’ and data’s users?
- Who are the decision-makers and buyers, respectively the sponsors?
- Who are potential supporters? Who might be a saboteur?
The Stakeholder Analysis canvas can help you to answer questions like these.
III. When does the workshop take place and how long does it last?
The canvas is designed for two-day workshops because speaking of experience one day is not sufficient. Other than that it’s not realistic that all participants can or want to leave their day-to-day job for three days. So a two-day workshop seems to be a good compromise. It might be also advisable to schedule several workshops.
Hence, the canvas is divided into two parts:
- At the top: 1. day – for example to get an overview about the as-is situation and to develop an outlook for the to-be state.
- At the bottom: 2. day – to get deep insights into a field of application / an use case and to develop a perspective for a potential solution.
Furthermore, both parts representing the two days are divided into two more parts: morning (1. day upper-left and 2. day lower-right) and afternoon (1. day upper-right and 2. day lower-left). In between, a longer lunch break should be planned to get again to a clear mind.
As a result of the combination with the four phases (Overview, Viability, Desirability & Feasibility) there are two-time blocks with two time slots 45 minutes each. Those slots need to be filled with a concrete agenda. The boxes help you to respect the slots (timeboxing).
Breaks can be planned into the transition between the phases. Therefore the workshop participants can work 1.5 hours nonstop without any interruption (important!).
An exemplary agenda could look as follows:
Day #1:
- 09:00am welcoming the participants
- 09:15am box #1 & #2
- 10:45am break
- 11:00am box #3 & #4
- 12:30pm lunch break
- 1:30pm box #5 & #6
- 3:00pm break
- 3:15pm box #7 & #8
- 4:45pm feedback
- 5:00 end
Day #2: equivalent to day #1
The canvas can be adapted as follows in case there is only one day available:
- The upper part corresponds to the morning and the lower one to the afternoon.
- In each phase there is only every second time slot (box) available meaning the boxes #2, #4, #6 and so on stay empty.
Step 1 of 5
Intro
Start the first workshop day by introducing the participants and a general introduction:
- What’s the objective of the workshops and the project as a whole?
- Who are the participants? It’s good practice that each participant answers the following three questions with one short sentence: “who am I? what do I Do? what do I expect?”
- How will the workshop be run? Use the Data Strategy Designguide to guide the participants through the two days.
- Which tools (canvas) will be used? Introduce the tools so the participants know what they can expect.
The intro phase is used to bring all participants to the same level of knowledge, to get their focus on a common objective, and to lay out a joint way to reach it. Factor in enough time for questions and discussions. This is especially true if this is the first workshop of this kind. If you need less time though you’ve gained a buffer that you might need at the end of the workshop.
Place for example a blue card into the first box stating “introduce and discuss objectives, participants & agenda”. Write another one “introduce method & tools” and place it into the second box.
Step 1 of 5
During the workshop, as soon as you’ve finished working on one box, you can change the color of the card to green. This is to highlight the progress. By doing so you have also a fast and visual overview of how you are doing with respect to time.
It is recommended to use the Data Strategy Design card decks for the following steps (i.e. boxes). This card deck includes all pictograms of all canvas of the Data Strategy Designkit. Use the pictograms as cards to highlight which canvas you use in which step with which purpose. This you do by placing the card into the respective box and add a corresponding text for the purpose.
The Data Strategy Designkit canvas provides you with an overview of the canvas tools which are available as part of the Datentreiber data strategy designkit. The canvas also tells you how you can combine the canvas with each other. Equivalent to the phases (green, yellow, and blue) in the designguide, the designkit canvas differentiates the canvas tools into three areas which are viability (green), desirability (yellow), and feasibility (blue). This helps you to find the right tool at the right point in time.
However, please consider this classification only as a proposal: you might as well use a “blue tool” in the “green phase”. Furthermore, you are free to use other canvas tools as an alternative or even develop your own ones.
Step 2 of 5
Business Understanding
You should start your data journey by asking questions like “why do we need data & analytics?”. What’s your company’s vision? Which are your business objectives? In which area should we invest in order to gain a benefit from data and analytics?
It’s crucial to align your data strategy with your corporate strategy. Hence, use the first phase of the data strategy design to get a clear view regarding the current economical situation as well as the future business strategy. The following canvas assists you in doing so:
- Strategy Pyramid: to outline or define your company’s vision & mission, core values & guidelines as well as milestones.
- Value Chain: to visualize and analyze the creation of value within your industry or to visualize and analyze internal processes.
- Growth Horizons: to become clear if you are looking for incremental or disruptive innovations.
- Business Model / Case: to scrutinize your own business model searching for potential optimizations or to design new data driven business models.
At the beginning of the “green phase” it is important to develop a broad understanding of the business. Contrary, in the end, you should focus on a concrete field of application, application area, or use case in order to get to a detailed user understanding throughout the next phase.
Step 3 of 5
User Understanding
The second phase, which is the “yellow” one, needs to answer the question “how can data & analytics help us?”. For this, we need to understand who is driving the business respectively the business area and what’s driving this person or role. Who is making which decisions, taking which actions, is after which goals and is expecting which results? Which concrete problems are occurring and how can data and analytics help to solve those problems and add value for the user?
Many initiatives and projects in the data and analytics space fail because of lacking user acceptance. The designkit offers you the following tools to develop user-centric data strategies and data products:
- Stakeholder Analysis: to identify the right users, decision-makers and further stakeholders.
- Analytics Use Case: to conceptualize a concrete analytics solution for a specific user.
- Value Curve to design data and analytics products which differentiate themselves from the (internal as well as external) competition.
At the end of the “yellow phase” there should be one or more concrete ideas for projects which can be made more concrete from an analytical and technical perspective in the following, the “blue phase”.
Step 4 of 5
Data Understanding
Now that you know which direction you want to take (economical strategy) and how you want to get there (functional solution), it’s on you to answer the question of what you need to do so. Especially “what kind of data & analytics do we need?”. Many analytics projects are not feasible because the required data (the required amount, depth, and quality) is missing. Or the analytic’s complexity exceeds the analytical maturity of your company.
To overcome these hurdles on your way to a successful data strategy and successful data products you can for example use the following tools:
- Analytics Maturity: to determine your company’s or a certain area’s analytics maturity and to develop a roadmap for the analytics projects.
- Data Strategy: to derive the resources (data, processes, products, staff, partners) necessary to make a data strategy happen or to develop a data product.
- Data Landscape: to explore the data landscape of the company, identify further data sources and reveal potential gaps.
- Data Management: to increase data availability and data quality as well as to secure data security and privacy.
At the end of the “blue phase” you should know if your plan works out or where there are gaps which you need to close first.
Step 5 of 5
Outro
Reserve two time slots (i.e. about 1.5 hours) at the end of the second day. This is to reflect on your work and to summarize the results. As soon as your workshop ends your participants need to know what they have got to do next. Furthermore, it should be clear what are the mid- and long-term steps.
Speaking from experience it is advisable to do the following:
- Storytelling: run once again through all phases and steps of the workshop and tell (as workshop moderator) the story how you got there and where you are at the end of the workshop.
- Critical assumptions & open questions: the other participants focus on checking the plausibility of the story, its consistency and completeness. If there are ambiguities or uncertainties, these critical assumptions and open questions need to be mentioned and documented. You can use white cards for that.
- HELD: finally the critical assumptions and open questions should be prioritized according to their criticality as well as reviewed once again. Which wrong assumptions or missing information can jeopardize the project or strategy? A Hypotheses, Experiments & Learnings Database can be of good use when doing this. You can find a Datentreiber HELD template on Airtable.
Completion
Most often the workshop is only the kickoff and not the end. Best case you and your team can for example start with a Data (Product Design) Sprint straight after the workshop. However, most probably you will meet for a second, third and so on workshop to further concretize the strategy or to think through further use cases. Hence, you can check throughout the “green phase” with the Business Model / Case canvas in a second iteration (workshop) if your data strategy is viable by thinking through your business cases with this canvas.
We drive your business forward.
How Do I Use the Data Strategy Designguide Canvas?
Here you can find further documentation:
Planen Sie Ihre Datenstrategie-Workshops visuell. (Blog)
Data Thinker-Group (LinkedIn)
We drive your business forward.
How Can I Start?
Seminars

Get to know our Data Strategy Design Method in our practical seminars:
- For beginners: Data Strategy & Culture
- For rising stars: Data Design Thinking
- For advanced designers: Data Business Consulting
Cross References

Here you can find further canvas and information concerning Data Strategy Design:
License Terms

You are free to:
Share — copy and redistribute the canvas in any medium or format
Adapt — remix, transform, and build upon the canvas
for any purpose, even commercially.
Under the following terms:
Attribution
ShareAlike
We drive your business forward.
Subscribe to our newsletter:
Receive all relevant blog articles, new seminar dates, special conference offers and much more conveniently by email. As a welcome gift, we will send you a link to download our Datentreiber design book (in German) and, for a short time, the article ” Data Thinking: mehr Wert aus Daten” in PDF form after your registration.
By clicking ‘Subscribe to our newsletter’ you agree that we process your information in accordance with our privacy policy.


