Analytics Maturity Canvas
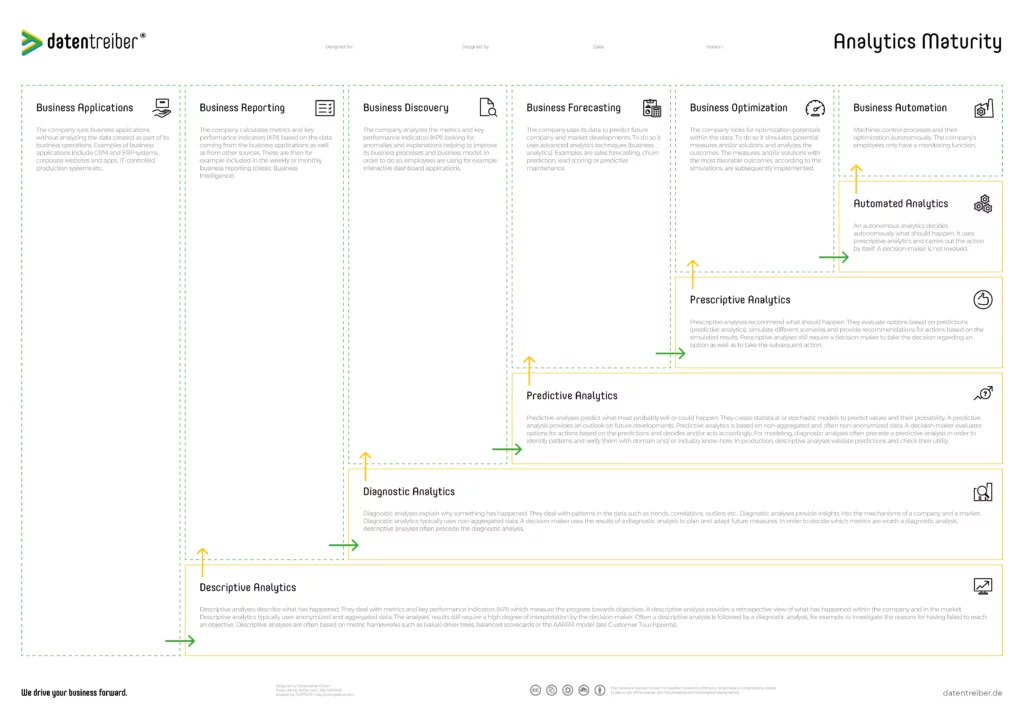
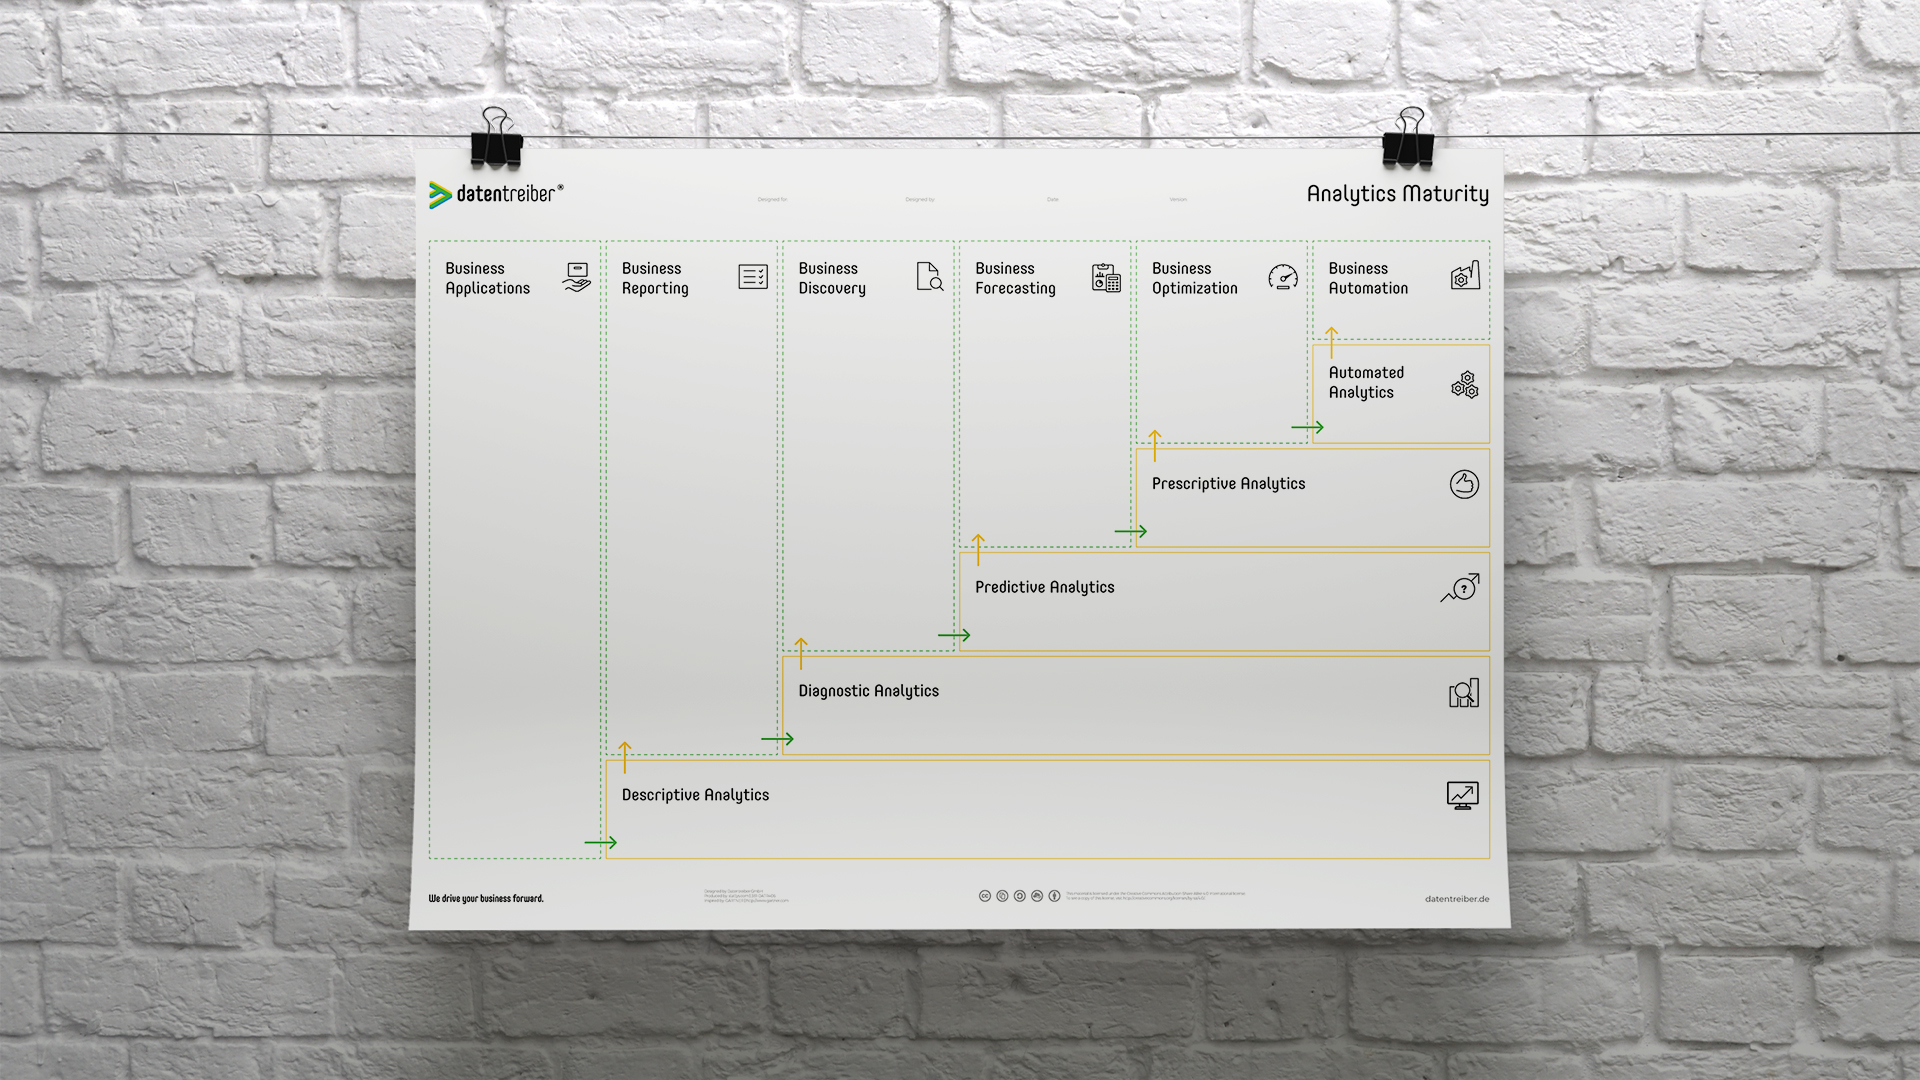
Using the Analytics Maturity Canvas you can determine the analytical maturity of your company or department. Furthermore it allows you to develop a roadmap laying out how to gradually increase the maturity. The Analytics Maturity Canvas as a tool for prioritizing helps you to find out which analytics project you should start next and which tools you need to do so.
We drive your business forward.
What Is the Analytics Maturity Canvas?
The Analytics Maturity Canvas is a prioritization tool for data strategies (cf. Data Strategy Canvas). While working on the Data Strategy Design you develop many ideas on how to utilize your data with analytical tools. These can be primarily differentiated according to their analytical maturity:
- Descriptive Analytics is enabling reporting to monitor what has happened.
- Diagnostic Analytics is the prerequisite for data exploration to analyze why something has happened.
- Predictive Analytics is used to create forecast models to simulate what could happen.
- Prescriptive Analytics evaluates measures for optimization to recommend what should happen.
- Automated Analytics controls automation processes to decide what has to happen.
By arranging the existing as well as the already planned prospective analytics applications according to their maturity, you develop a step-by-step implementation roadmap.
The Analytics Maturity Canvas is available for free under a Creative Commons license: you may use and modify the canvas as long as you cite Datentreiber in particular as the source.
We drive your business forward.
We drive your business forward.
How Do I Use the Analytics Maturity Canvas?
The Analytics Maturity model helps you to find out:
- Which analytical maturity does my company, do individual departments of my organization or my customers have?
- Which are possible data-driven applications and their requirements for the company, the department or the customer regarding the analytical maturity level?
- Which are the relevant use cases to take my company, departments or customers to the next analytical level?
- Which analytical tools do I need for the realization of the applications?
For more information, see Data Strategy Design.
Start
Start working on the Analytics Maturity template by documenting the current state of your company, department, or customer. Focus your attention on the following two aspects:
- Use cases: which analytics solutions or applications are already in use in your company and for what purposes? To do this, fill the boxes (application fields) in the upper green area (=utilization) from left to right with the appropriate cards.
- Tools: which analytical tools, procedures, or software systems do you use for this? You answer this question in the lower yellow area (=refinement).
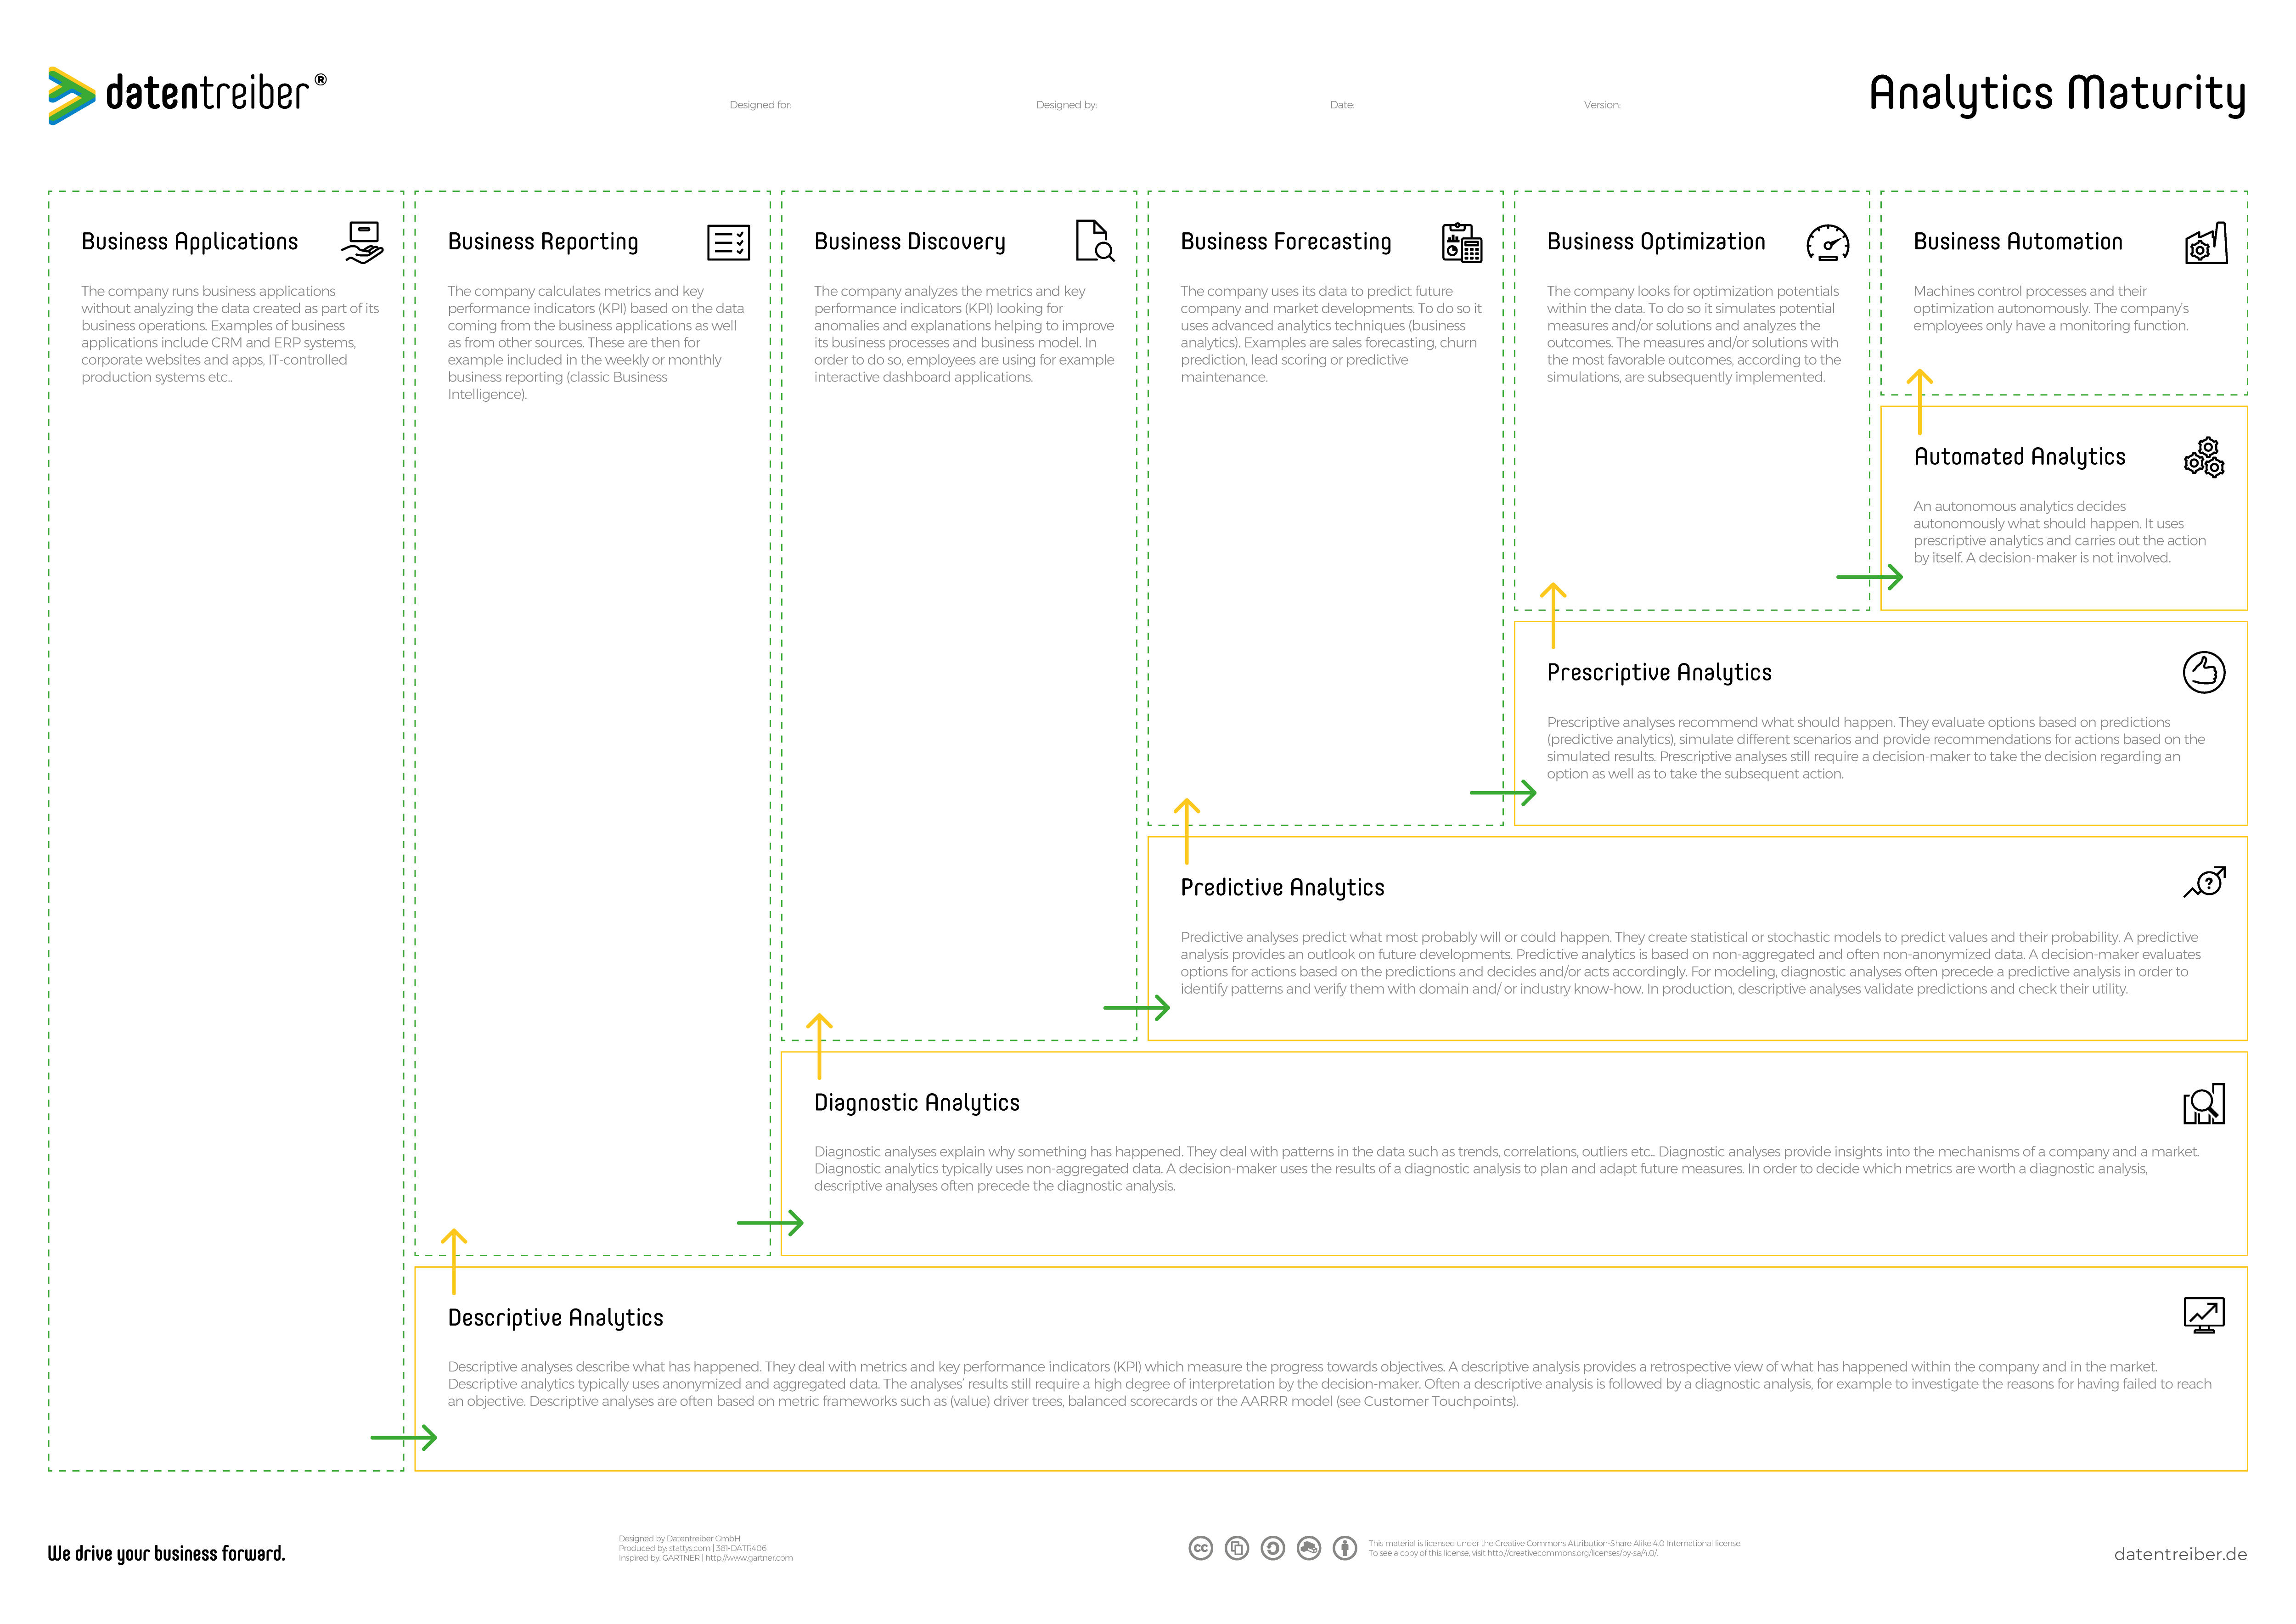
The boxes reflect the level of analytical maturity, and the analytical maturity level determines the complexity of the particular application or tool. The analytical maturity levels (yellow area below) are interdependent: to make predictive analytics (predictions), you first need diagnostic tools to identify patterns in the data. Correspondingly, companies (green area above) also undergo a maturing process (from left to right). As the complexity increases from bottom to top (yellow area), the value-added from the data (green area) increases from left to right. It is the goal of companies to continuously increase their maturity level by introducing appropriate tools and applications based on them. A detailed explanation of the individual maturity levels and maturity process steps can be found below.
After you have documented the actual state, start by specifying the target state by filling the green boxes at the top and the yellow boxes at the bottom – from left to right or from bottom to top. Use different colors for the cards:
- Green: existing applications or tools
- Yellow: applications or tools which are planned or whose development is in progress
- Red: required or desired applications or tools
Pay attention to consistency while filling it in:
- There must be an appropriate analytics tool for every analytics application. For example, for a marketing KPI dashboard, you might need a (self-service) Business Intelligence tool.
- Conversely, there should be at least one analytical use case for an analytical tool. Otherwise, this means that the tool is not in use and therefore may produce unnecessary costs for your business.
- The maturity level of the analytical application must match the maturity level of the analytical tool. To make predictions, such as revenue forecasting, you need a predictive analytics tool.
Step 1 of 11
Business Applications
The company runs business applications without analyzing the data created as part of its business operations. Examples of business applications include CRM and ERP systems, corporate websites and apps, IT-controlled production systems, etc.
Examples of applications:
- CRM software
- ERP systems
- Corporate websites
- E-commerce websites
- Mobile apps
- IT supported production systems
Step 2 of 11
Descriptive Analytics
Descriptive analyses describe what has happened. They deal with metrics and key performance indicators (KPI) which measure the progress towards objectives. Descriptive analysis provides a retrospective view of what has happened within the company and in the market. Descriptive analytics typically uses anonymized and aggregated data. The analysis’ results still require a high degree of interpretation by the decision-maker. Often a descriptive analysis is followed by a diagnostic analysis, for example, to investigate the reasons for having failed to reach an objective. Descriptive analyses are often based on metric frameworks such as (value) driver trees, balanced scorecards, or the AARRR model (see Customer Touchpoints Canvas).
Examples of tools:
- Classical Business Intelligence solutions
- Manually created reports in spreadsheets
- (Online-) Analytics services
- Reporting tools
Step 3 of 11
Business Reporting
The company calculates metrics and key performance indicators (KPI) based on the data coming from the business applications as well as from other sources. These are then, for example, included in the weekly or monthly business reporting (classic Business Intelligence).
Examples of applications:
- Marketing KPI dashboards
- Sales reports
- Production statistics
Step 4 of 11
Diagnostic Anayltics
Diagnostic analyses explain why something has happened. They deal with patterns in the data such as trends, correlations, outliers, etc. Diagnostic analyses provide insights into the mechanisms of a company and a market. Diagnostic analytics typically uses non-aggregated data. A decision-maker uses the results of diagnostic analysis to plan and adapt future measures. In order to decide which metrics are worth a diagnostic analysis, descriptive analyses often precede the diagnostic analysis.
Examples of tools:
- Business discovery applications
- Self-service BI solutions
- Statistical tools
- Testing tools
- Visualization tools
- Analytical programming languages
Step 5 of 11
Business Discovery
The company analyzes the metrics and key performance indicators (KPIs) looking for anomalies and explanations helping to improve its business processes and business model. In order to do so, employees are using, for example, interactive dashboard applications.
Examples of applications:
- Ad hoc analysis for customer insights
- A/B testing of website designs
- Multivariate testing in online advertising
- Correlation and trend analysis based on social media monitoring
- Analysis of causes of defects in production
- Customer segmentation
Step 6 of 11
Predictive Analytics
Predictive analyses predict what most probably will or could happen. They create statistical or stochastic models to predict values and their probability. A predictive analysis provides an outlook on future developments. Predictive analytics is based on non-aggregated and often non-anonymized data. A decision-maker evaluates options for actions based on the predictions and decides and/or acts accordingly. For modeling, diagnostic analyses often precede a predictive analysis in order to identify patterns and verify them with domain and/or industry know-how. In production, descriptive analyses validate predictions and check their utility.
Examples of tools:
- Predictive modeling tools
- Data mining tools
- Data Science suites
- Analytical programming languages
- Machine-Learning-as-a-Service
Step 7 of 11
Business Forecasting
The company uses its data to predict future company and market developments. To do so it uses advanced analytics techniques (business analytics). Examples are sales forecasting, churn prediction, lead scoring, or predictive maintenance.
Examples for applications:
- Sales forecasts
- Prediction of churns
- Customer rating (“lead scoring”)
- Calculation of the customer lifetime value
Step 8 of 11
Prescriptive Analytics
Prescriptive analyses recommend what should happen. They evaluate options based on predictions (predictive analytics), simulate different scenarios, and provide recommendations for actions based on the simulated results. Prescriptive analyses still require a decision-maker to make the decision regarding an option as well as to take the subsequent action.
Examples of tools:
- Modeling tools
- Simulation tools
- Data Science suites
- Analytical programming languages
Step 9 of 11
Business Optimization
The company looks for optimization potentials within the data. To do so it simulates potential measures and/or solutions and analyzes the outcomes. The measures and/or solutions with the most favorable outcomes, according to the simulations, are subsequently implemented.
Examples of applications:
- Controlling of advertisements
- Recommendation systems for products
- Predictive maintenance
- Churn prevention
Step 10 of 11
Automated Analytics
Autonomous analytics decides what should happen. It uses prescriptive analytics and carries out the action by itself. A decision-maker is not involved.
Examples of tools:
- Marketing automation solutions
- Service orchestration tools
- Agent systems
- Artificial Intelligence systems
Step 11 of 11
Business Automation
Machines control processes and their optimization autonomously. The company’s employees have only a monitoring function.
Examples for applications:
- Dynamic pricing
- Autonomous vehicles or aircrafts
- Intelligent storage
- High frequency stock trading
Completion
After you have completely documented the actual status and defined the target state sufficiently, you should once again carry out a final consistency check (see checklist above). The next crucial step is to select the applications which will increase the analytical maturity of your business – without skipping a step to minimize risk, effort, cost, and project duration, resulting in a rapid return on investment, and to benefit from the analytical optimization potential in a timely manner.
Rather take many small and fast steps versus one big and slow step. Anyone who has ever tried to take two or more steps at a time on stairs knows how exhausting it is and how dangerous it can be.
Therefore, when selecting the relevant applications, the following points should be considered:
- Use cases in applications with a high density of green cards (i.e. existing applications and solutions) are likely to only marginally increase the company’s efficiency and effectiveness. The potential for optimization, for example through Business Intelligence solutions, is already exhausted if a corresponding reporting system has already been introduced for all departments.
- Unoccupied fields of applications or boxes with many red cards (i.e. missing applications), however, suggest a high value creation potential.
- However, it must be checked whether the corresponding analytical tools for this purpose are available in the company. For example, optimization applications require prescriptive analytics tools. If these tools are not yet available, they must first be bought and implemented in the company. This usually requires a costly evaluation of the tools as well as time consuming training of employees.
- Accordingly, no analytical maturity level should be skipped. For example, if the company uses only descriptive analytics tools for reporting, and wants to use predictions, i.e., develop predictive analytics solutions, to take two levels in the maturity model, then first introduce diagnostic tools and identify use cases to directly benefit of these tools and to gradually increase the degree of maturity in the company and in particular among the employees.
Finally, you select the use cases that take the maturity of the company to the next level. You can then use the Data Strategy canvas to specify the respective use cases.
References:
- Value Proposition: for example, to identify data-driven applications and solutions (value propositions) for customers offered as products or services.
- Business Model: key activities such as marketing controlling require analytical applications (for example, KPI reporting). Customer relationships can be also based on analytical applications such as chatbots. After all, the analytic solutions may be a key resource.
- Data Strategy: to specify specific use cases and to determine the required analytic maturity level (i.e. the analytics tools).
- Data Landscape: to identify possible use cases based on the available data.
We drive your business forward.
Where Can I Find More Information?
The presentation referred to beside introduces you to the Data Strategy Design method and Analytics Maturity Canvas by means of an example project.
Here you can find further documentation:
Your first step towards a data-driven company (Blog)
Data-Driven Marketing – The first steps towards a Data-Driven Marketing (SlideShare)
Data Thinker Group (LinkedIn)
The Analytics Maturity Canvas is based on the Gartner Analytics Maturity Model which is among many other resources also described in the following article: The Analytics Maturity Model.
We drive your business forward.
How Can I Start?
Seminars
Get to know our Data Strategy Design Method in our practical seminars:
- For beginners: Data Strategy & Culture
- For rising stars: Data Design Thinking
- For advanced designers: Data Business Consulting
We drive your business forward.
Subscribe to our newsletter:
Receive all relevant blog articles, new seminar dates, special conference offers and much more conveniently by email. As a welcome gift, we will send you a link to download our Datentreiber design book (in German) and, for a short time, the article ” Data Thinking: mehr Wert aus Daten” in PDF form after your registration.
By clicking ‘Subscribe to our newsletter’ you agree that we process your information in accordance with our privacy policy.
