Value Chain Canvas
Using the Value Chain Canvas you can analyze the production, logistics, marketing and sales processes of your company, your customers or your industry. It helps you for example to identify new customers, products or data suppliers or to structure your processes and optimize them.
We drive your business forward.
What Is the Value Chain Canvas?
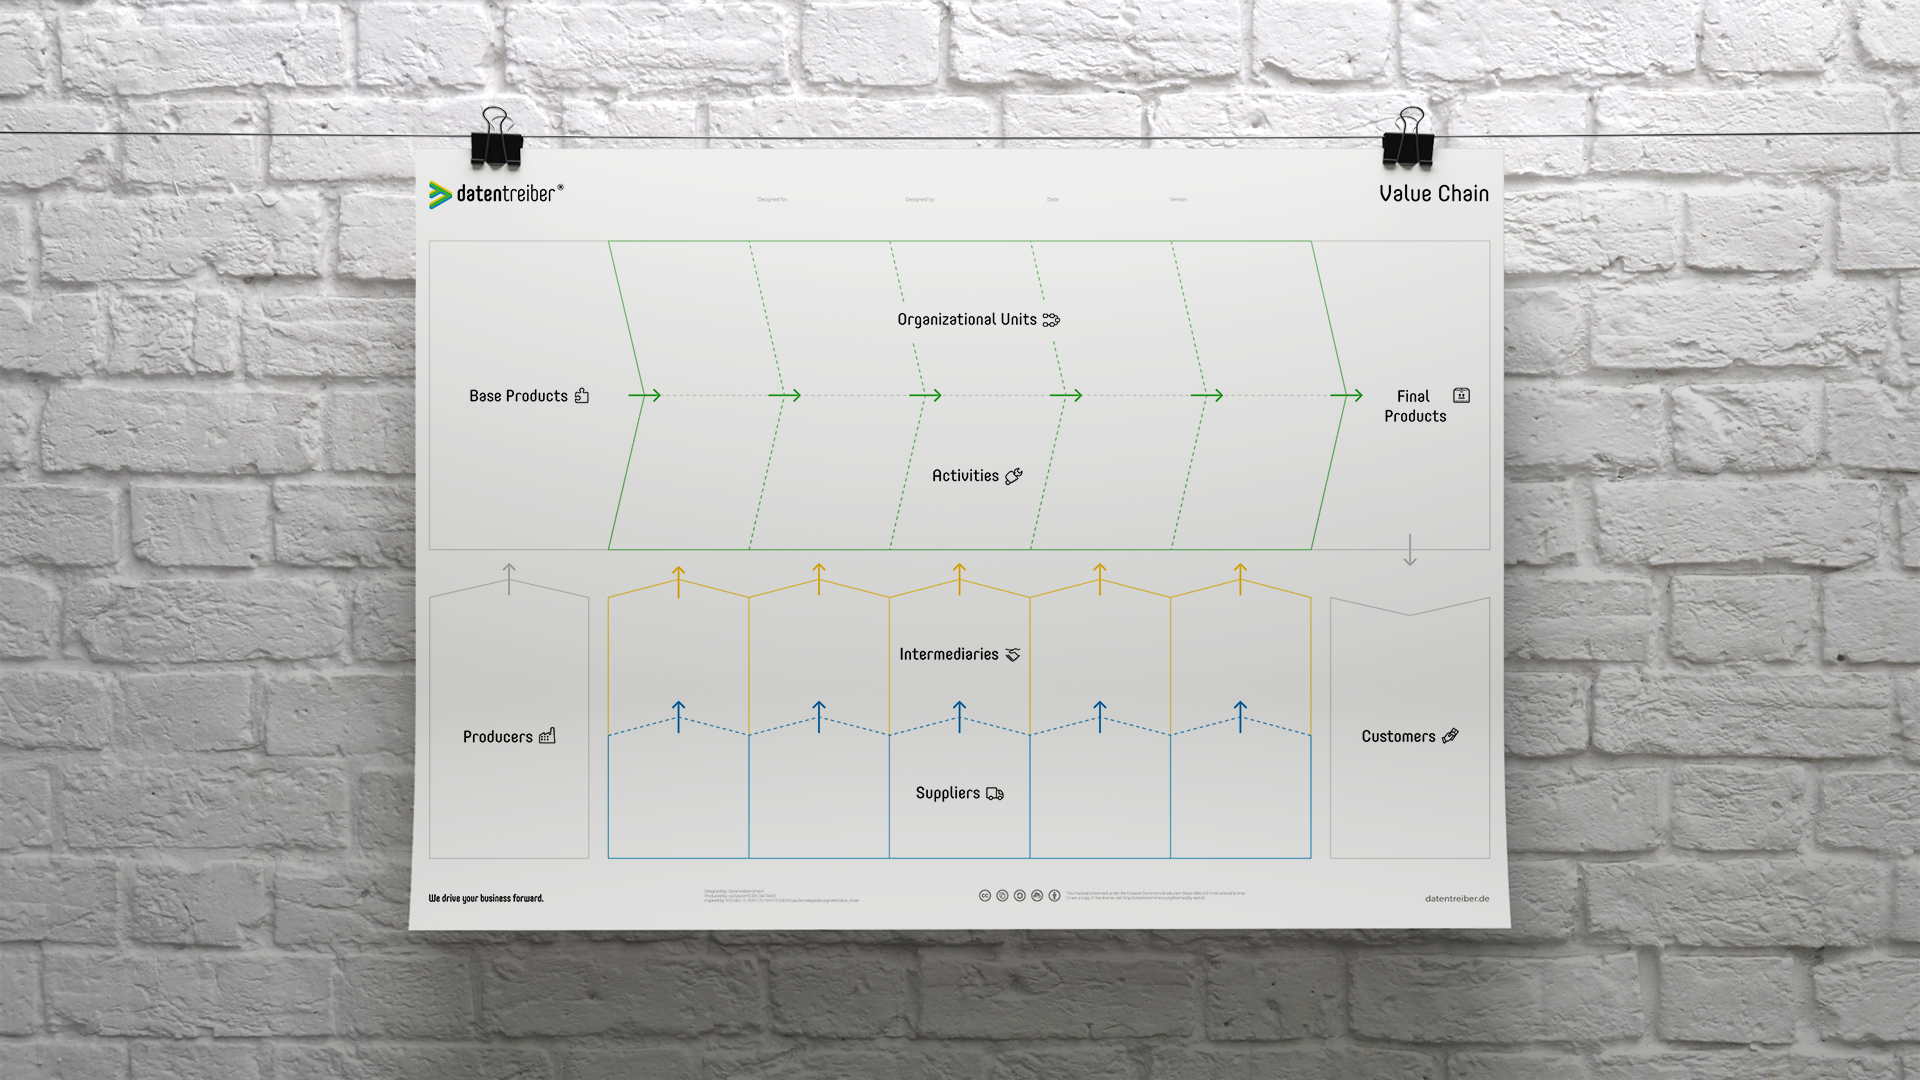
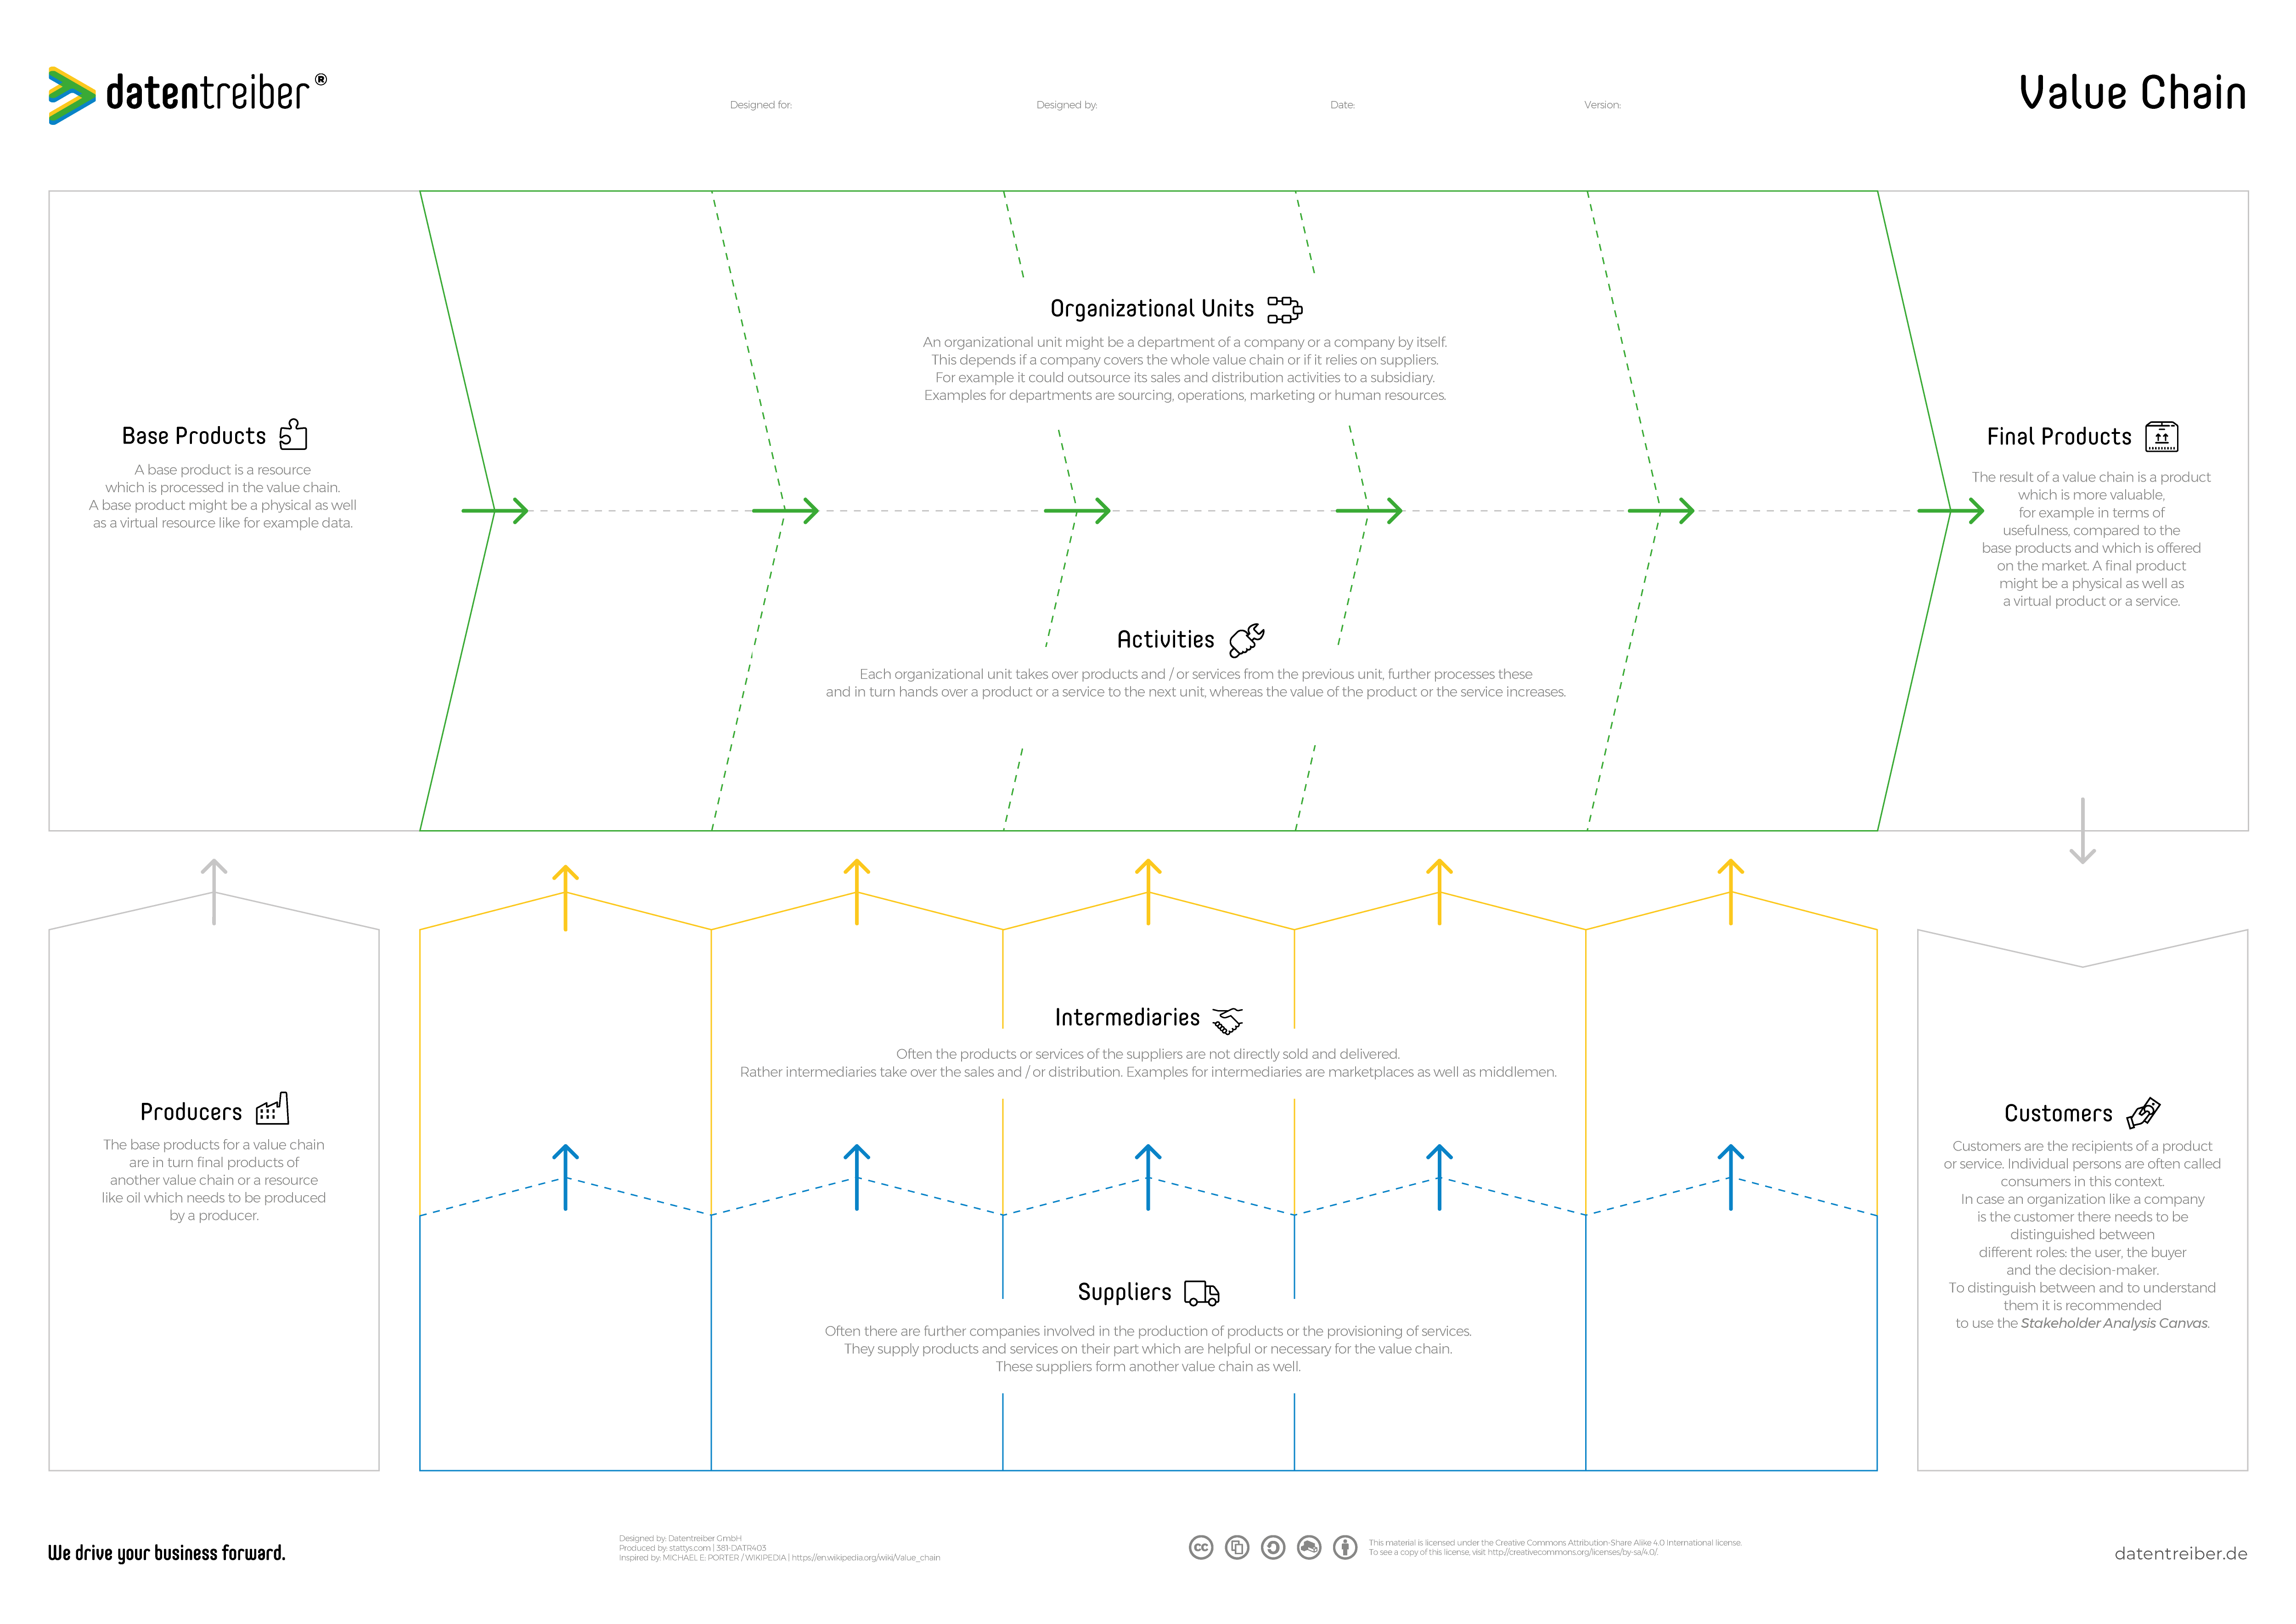
The Value Chain Canvas is an analysis tool that allows, for example, to optimize your business model or to discover new customers and potential new products. Using the canvas you identify the relevant stakeholders which contribute in a certain industry, segment, or process to the creation of value:
- Producers: who is providing the base products for the value chain?
- Organizational units: which subcontractors, sister companies, or departments are conducting activities to convert the base products to the final products, to market, sell or deliver them?
- Customers: who are the consumers respectively the buyers of these final products?
- Suppliers: which further companies supply raw materials, tools, machines, packaging, services etc. ?
- Intermediaries: are there any intermediaries, marketplaces or agencies which take over marketing, sales and / or the distribution?
The Value Chain Canvas is available for free under a Creative Commons license: you may use and modify the canvas as long as you cite Datentreiber in particular as the source.
We drive your business forward.

We drive your business forward.
How Do I Use the Value Chain Canvas?
The Value Chain canvas supports you in:
- Optimizing your operations and supply chain by outsourcing activities or reintegrating previously outsourced ones.
- Tapping new business opportunities by extending your business activities along your value chain or by identifying new customer segments along the value chain in your industry.
- Increasing the efficiency of your business processes or your business model by eliminating unnecessary intermediaries or unprofitable intermediate process steps.
For more information, see Data Strategy Design.
The Value Chain canvas is divided into the following areas and fields:
- Customers and final products: what’s the outcome of the value chain (=final products) and who is consuming respectively buying the final products? The outcome might be a physical product, service, software, information, etc. The final products do have a higher value compared to the base products.
- Producers and base products: the base products are at the beginning of the value chain. They are supplied by the producer. Base products are for example commodities, manpower, data, etc.
- Organizational units and activities: to process the base products in order to become the final products as well as to sell them to the customers, there are diverse processing steps necessary. These are called activities. These activities are taken over by different organizational units. For instance, operations are taking care of the final products’ production, marketing of merchandising, the sales department of the sales, logistics of the distribution, and so on. Organizational units can be single persons or positions, departments, divisions within the company or subsidiaries respectively third-party companies.
- Suppliers and intermediaries: to conduct their activities, the organizational units need support from further companies. These are the suppliers. They provide personnel, (expert) know-how, tools, services, and much more stuff. Companies do not always buy these external services directly. Rather they often make use of third-parties, the so-called intermediaries. Examples of intermediaries are marketplaces or buying syndicates.
Objective
First, decide what you would like to achieve with the Value Chain canvas. Accordingly, you design, based on the canvas, the value chain of your own company or your customers respectively of your industry in general:
- Planning and optimizing your own business processes or models: value chain of your company.
- Identifying new business opportunities and customer segments: the value chain of your customer respectively your industry.
Start
Start by either filling the canvas coming from the customer and final products side (right-hand side) or coming from the producers and base products (left-hand side). Work your way along the value chain to the left or to the right afterward. Think first which are the necessary activities and then which organizational unit is taking care of each.
Suppliers
After having completely drawn the value chain (upper green area), turn to the suppliers and intermediaries (lower blue and yellow area). Identify which services the organizational units require for fulfilling the activities and who is supplying these. Decide in each case if the one who is supplying the service is providing it autonomously i.e. it’s a supplier or if it’s an intermediary arranging it.
Completion
As soon as all fields are filled, check if the value chain is complete or if you might have missed important steps. Depending on your objective you can analyze the value chain according to the following questions and plan it again from scratch respectively:
- Which activities can be outsourced in order to save costs and / or time?
- Which outsourced activities should be reintegrated into the company in order to minimize for example dependencies or to increase quality?
- How can we increase the value-added by taking over upstream or downstream activities on our own, for example by entering direct sales business for our products or by producing them on our own?
- Which additional products can we integrate into our portfolio because they have a similar production or distribution chain?
- How can we save in the space of our suppliers by reducing for example the number of suppliers and benefit from volume discounts?
- Which intermediaries can we avoid in order to source lower-priced external services?
- Which intermediaries could offer more beneficial terms and conditions for our purchases because they receive discounts as part of a buying syndicate?
In contrast, if you have modeled the value chain of your customers respectively your industry ask yourself the following questions:
- Which activities could we take over and accordingly contribute to the value add?
- Which services do the customers buy which we in turn could supply as a supplier or intermediary?
- Which additional companies along the value chain could benefit from our offering?
Outlook
Afterward, you can use the result to rework or complete your Business Model / Case Canvas. In case you have identified new customer segments while working in the Value Chain canvas, use the Analytics Use Case Canvas, to understand your customers’ needs and to design corresponding analytical offers.
We drive your business forward.
Where Can I Find More Information?
Here you can find further documentation:
Data Thinker-Group (LinkedIn)
You can find an introduction to the value chain’s concept in Wikipedia: Value Chain.
We drive your business forward.
How Can I Start?
Seminars

Get to know our Data Strategy Design Method in our practical seminars:
- For beginners: Data Strategy & Culture
- For rising stars: Data Design Thinking
- For advanced designers: Data Business Consulting
Cross References

Here you can find further canvas and information concerning Data Strategy Design:
License Terms

You are free to:
Share — copy and redistribute the canvas in any medium or format
Adapt — remix, transform, and build upon the canvas
for any purpose, even commercially.
Under the following terms:
Attribution
ShareAlike
We drive your business forward.
Subscribe to our newsletter:
Receive all relevant blog articles, new seminar dates, special conference offers and much more conveniently by email. As a welcome gift, we will send you a link to download our Datentreiber design book (in German) and, for a short time, the article ” Data Thinking: mehr Wert aus Daten” in PDF form after your registration.
By clicking ‘Subscribe to our newsletter’ you agree that we process your information in accordance with our privacy policy.


