Summary and Context
Martin Szugat has developed a method for data strategy design with his strategy consulting company Datentreiber. The Data Strategy Designkit, which is used for this method, is available as open source on ourwebsite. Based on the canvas methodology, the Designkit supports the successful development of a data strategy in your company. While you can read here why you need a data strategy at all, this article already gives you a brief introduction to using the Data Strategy Designkit.
In the six-part series of articles starting with this article, which is based on the contents conveyed in the Datengipfel seminars, you will learn which path leads you to a successful data strategy with added value and which questions you will expect along the way.
Do You Let Hippos Decide?
Are you already investing a lot of time in technology and data analysis? Nevertheless, data leads a shadowy existence in your business when it comes to decisions? Then you probably lack the foundation of a data-driven company: the right corporate culture.

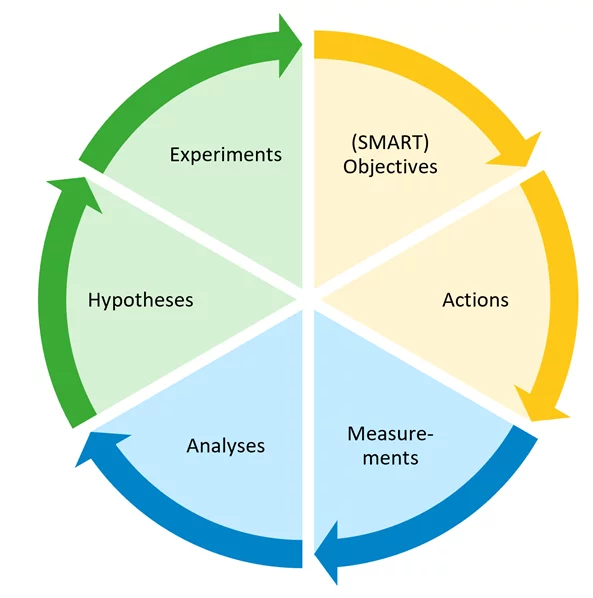
Without measurable goals, the actions taken to achieve the goals cannot be measured, which means not evaluated. So, every analysis with data leads into nothing. Moreover, testing improvements based on hypothesis and thus measurable experiments is also not possible. What follows is the so-called HiPPO principle: it is not decided based on data but the “Highest Paid Person’s Opinion” wins.
So, you need SMART goals:
- Specific: goals must be clearly defined.
- Measurable: goals must be measurable.
- Attractive: goals must be appealing or desirable for the person addressed.
- Realistic: goals must be realistic.
- Scheduled: goals must be set with a date
Formulating such goals requires some practice and will be developed together with the participants in the Datengipfel seminars by means of practice examples. There are also newer methods brought up, such as the OKR approach, which was shaped by John Doerr or Google.
Decide or Let Decide?
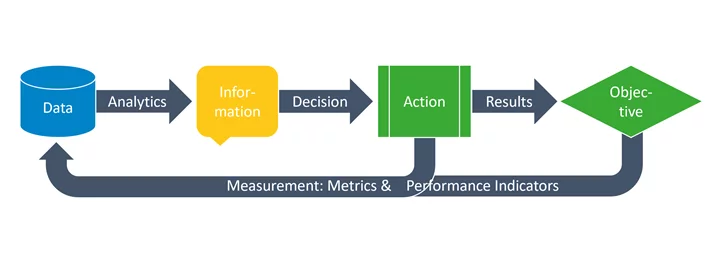
Depending on the analytics used, the method brings you closer to a decision or even analytics decides autonomously and sets the appropriate action.

The analytical methods can be differentiated according to the questions that can be answered or the autonomy of the decision, as follows:
- Descriptive: What happened?
- Diagnostic: Why did it happen?
- Predictive: What will happen?
- Prescriptive: What should happen?
- Autonomous: Let it happen.
Essential characteristics of the listed methods are that they build on each other and increase their added value from top to bottom. However, this also applies to their complexity and the associated risks.
It is important for you to work out where you are in terms of analytics and where you want to go. Martin Szugat repeatedly mentions in the Datengipfel seminars how important it is for companies to go one step at a time. Adapted to current skills and possibilities.
The determination of position and ambition can be worked out very well with the Analytics Maturity canvas. Based on this, the next-best step can be defined. The Analytics Maturity Canvas is covered in the 3rd article of this series.
Measure What Really Counts and Put It in Context
Goals are measured by KPIs (Key Performance Indicators). So, a special category of metrics that indicate the degree of goal achievement. As with data, many companies often experience a flood of KPIs.
You must be careful not only that the relevant is measured, but also that the measurement itself is correct. The former aims at the correct derivation of the KPIs from the goals. Secondly, among other things, finding the right measuring points and technical considerations. For both, the Customer Touchpoints canvas helps you, which will be covered in the next article in this series of articles.
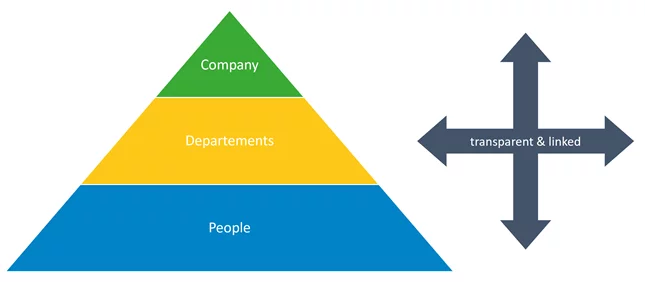
You also need to make sure that both the KPIs and the metrics you build on are in an overall context. So, make sure that the different levels in your business are connected.

This merge is best achieved with the help of a so-called value tree. A concept that has its origins in the so-called Du Pont scheme. With the aid of a value tree, they bring together downstream KPIs (e.g. sales generated via homepage) with the connected, upstream and directly controllable metrics (e.g. load time of the website or click-through rates).
Examples of value trees and the aspects to be considered when creating them are topics of the first Datengipfel seminar.
Conclusion and Outlook
This first article in the six-part series of articles shows you the context in which a successful data strategy is embedded, and which central questions must be answered along the way. Starting with the necessary corporate culture, setting (SMART) goals as well as measuring them or making decisions and setting actions with the right analytics.
The next article: Measure What Counts Where It Counts (2/6) goes into more detail on the Customer Touchpoints canvas, which helps you to find the right measuring points.
After this, the third article: Your First Step Towards a Data-driven Company (3/6) will show you how to use the Analytics Maturity canvas level to determine the location and define the next-best step on the way to your data strategy.
The Data Strategy canvas, covered in the fourth article: With a Data Strategy Against Your Thirst for Information (4/6), helps you to design and concretize the elements of your data strategy.
The Data Landscape canvas is the subject of the fifth article: Explore Your Data Landscape (5/6) . This helps you to clarify the technical requirements for your data strategy.
The sixth and final article: Hit the Sweet Spot With Your Data Strategy (6/6) in the series of articles deals with a complete overview of the Data Strategy Design.
Note: Author of this article, which was originally published in German language and in full length on the Datentreiber blog, is Martin Raffeiner, Managing Director at datenbotschafter consulting.

